Incident Management
Incident response
On-call preparation
Review Alerting 💡 and check Grafana dashboards 💡
On Android devices the following apps can be used:
-
Slack 🔧 app with audible notifications from the #ooni-bots channel
-
Grafana 🔧 viewer https://play.google.com/store/apps/details?id=it.ksol.grafanaview
Tiers and severities
When designing architecture of backend components or handling incidents it can be useful to have defined severities and tiers.
A set of guidelines are described at https://google.github.io/building-secure-and-reliable-systems/raw/ch16.html#establish_severity_and_priority_models This section presets a simplified approach to prioritizing incident response.
In this case there is no distinction between severity and priority. Impact and response time are connected.
Incidents and alarms from monitoring can be classified by severity levels based on their impact:
- 1: Serious security breach or data loss; serious loss of privacy impacting users or team members; legal risks.
- 2: Downtime impacting service usability for a significant fraction of users; Serious security vulnerability. Examples: probes being unable to submit measurements
- 3: Downtime or poor performance impacting secondary services; anything that can cause a level 2 event if not addressed within 24h; outages of monitoring infrastructure
- 4: Every other event that requires attention within 7 days
Based on the set of severities, components can be classified in tier as follows:
- tier 1: Anything that can cause a severity 1 (or less severe) event.
- tier 2: Anything that can cause a severity 2 (or less severe) event but not a severity 1.
- tier 3: Anything that can cause a severity 3 (or less severe) event but not a severity 1 or 2.
- …and so on
Relations and dependencies between services
Tiers are useful during design and deployment as a way to minimize risk of outages and avoid unexpected cascading failures.
Having a low tier value should not be treated as a sign of “importance” for a component, but a liability.
Pre-production deployment stages (e.g. testbed) have tier level >= 5
In this context a component can be a service as a whole, or a running process (daemon), a host, a hardware device, etc. A component can contain other components.
A component “A” is said to “hard depend” on another component “B” if an outage of B triggers an outage of A.
It can also “soft depend” on another component if an outage of the latter triggers only a failure of a subsystem, or an ancillary feature or a reasonably short downtime.
Regardless of tiers, components at a higher stage, (e.g. production) cannot depend and/or receive data from lower stages. The opposite is acceptable.
Components can only hard-depend on other components at the same tier or with lower values. E.g. a Tier 2 component can depend on a Tier 1 but not the other way around. If it happens, the Tier 2 component should be immediatly re-classified as Tier 1 and treated accordingly (see below).
E.g. anything that handles real-time failover for a service should be treated at the same tier (or lower value) as the service.
Redundant components follow a special rule. For example, the “test helper” service provided to the probes, as a whole, should be considered tier 2 at least, as it can impact all probes preventing them from running tests succesfully. Yet, test helper processes and VMs can be considered tier 3 or even 4 if they sit behind a load balancer that can move traffic away from a failing host reliably and with no significant downtime.
Example: An active/standby database pair provides a tier 2 service. An automatic failover tool is triggered by a simple monitoring script. Both have to be labeled tier 2.
Handling incidents
Depending on the severity of an event a different workflow can be followed.
An example of incident management workflow can be:
| Severity | Response time | Requires conference call | Requires call leader | Requires postmortem | Sterile |
|---|---|---|---|---|---|
| 1 | 2h | Yes | Yes | Yes | Yes |
| 2 | 8h | Yes | No | Yes | Yes |
| 3 | 24h | No | No | No | Yes |
| 4 | 7d | No | No | No | No |
The term “sterile” is named after https://en.wikipedia.org/wiki/Sterile_flight_deck_rule - during the investigation the only priority should be to solve the issue at hand. Other investigations, discussions, meetings should be postponed.
When in doubt around the severity of an event, always err on the safe side.
Regular operations
Based on the tier of a component, development and operation can follow different rules.
An example of incident management workflow can be:
| Tier | Require architecture review | Require code review | Require 3rd party security review | Require Change Management |
|---|---|---|---|---|
| 1 | Yes | Yes | Yes | Yes |
| 2 | Yes | Yes | No | No |
| 3 | No | Yes | No | No |
| 4 | No | No | No | No |
“Change Management” refers to planning operational changes in advance and having team members review the change to be deployed in advance.
E.g. scheduling a meeting to perform a probe release, have 2 people reviewing the metrics before and after the change.
Redundant notifications
If needed, a secondary channel for alert notification can be set up using https://ntfy.sh/
Ntfy can host a push notification topic for free.
For example https://ntfy.sh/ooni-7aGhaS is currently being used to notify the outcome of CI runs from https://github.com/ooni/backend/blob/0ec9fba0eb9c4c440dcb7456f2aab529561104ae/.github/workflows/test_new_api.yml
An Android app is available: https://f-droid.org/en/packages/io.heckel.ntfy/
Grafana 🔧 can be configured to send alerts to ntfy.sh using a webhook.
Test helper rotation runbook
This runbook provides hints to troubleshoot the rotation of test helpers. In this scenario test helpers are not being rotated as expected and their TLS certificates might be at risk of expiring.
Steps:
-
Review Test helpers, Test helper rotation and Test helpers notebook 📔
-
Review the charts on Test helpers dashboard 📊. Look at different timespans:
a. The uptime of the test helpers should be staggered by a week depending on Test helper rotation ⚙.
-
A summary of the live and last rotated test helper can be obtained with:
SELECT rdn, dns_zone, name, region, draining_at FROM test_helper_instances ORDER BY name DESC LIMIT 8-
The rotation tool can be started manually. It will always pick the oldest host for rotation. ⚠️ Due to the propagation time of changes in the DNS rotating many test helpers too quickly can impact the probes.
a. Log on backend-fsn.ooni.org 🖥
b. Check the last run using
sudo systemctl status ooni-rotation.timerc. Review the logs using
sudo journalctl -u ooni-rotationd. Run
sudo systemctl restart ooni-rotationand monitor the logs. -
Review the charts on Test helpers dashboard 📊 during and after the rotation.
Test helpers failure runbook
This runbook presents a scenario where a test helper is causing probes to fail their tests sporadically. It describes how to identify the affected host and mitigate the issue but can also be used to investigate other issues affecting the test helpers.
It has been chosen because such kind of incidents can impact the quality of measurements and can be relatively difficult to troubleshoot.
For investigating glitches in the test helper rotation ⚙ see test helper rotation runbook 📒.
In this scenario either an alert has been sent to the #ooni-bots Slack 🔧 channel by the test helper failure rate notebook 📔 or something else caused the investigation. See Alerting 💡 for details.
Steps:
-
Review Test helpers ⚙
-
Review the charts on Test helpers dashboard 📊. Look at different timespans:
a. The uptime of the test helpers should be staggered by a week depending on Test helper rotation ⚙.
b. The in-flight requests and requests per second should be consistent across hosts, except for
0.th.ooni.org. See Test helpers list 🐝 for details.c. Review CPU load, memory usage and run duration percentiles.
-
Review Test helper failure rate notebook 📔
-
For more detailed investigation there is also a test helper notebook
-
Log on the hosts using
ssh -o StrictHostKeyChecking=no -o UserKnownHostsFile=/dev/null -Snone root@0.th.ooni.org -
Run
journalctl --since '1 hour ago'or review logs using the query below. -
Run
top,strace,tcpdumpas needed. -
The rotation tool can be started at any time to rotate away failing test helpers. The rotation script will always pick the oldest host for rotation. ⚠️ Due to the propagation time of changes in the DNS rotating many test helpers too quickly can impact the probes.
a. Log on backend-fsn.ooni.org 🖥
b. Check the last run using
sudo systemctl status ooni-rotation.timerc. Review the logs using
sudo journalctl -u ooni-rotationd. Run
sudo systemctl restart ooni-rotationand monitor the logs. -
Review the charts on Test helpers dashboard 📊 during and after the rotation.
-
Summarize traffic hitting a test helper using the following commands:
Top 10 miniooni probe IP addresses (Warning: this is sensitive data)
tail -n 100000 /var/log/nginx/access.log | grep miniooni | cut -d' ' -f1|sort|uniq -c|sort -nr|headSimilar, with anonimized IP addresses:
grep POST /var/log/nginx/access.log | grep miniooni | cut -d'.' -f1-3 | head -n 10000 |sort|uniq -c|sort -nr|headNumber of requests from miniooni probe in 10-minutes buckets:
grep POST /var/log/nginx/access.log | grep miniooni | cut -d' ' -f4 | cut -c1-17 | uniq -cNumber of requests from miniooni probe in 1-minute buckets:
grep POST /var/log/nginx/access.log | grep miniooni | cut -d' ' -f4 | cut -c1-18 | uniq -cNumber of requests grouped by hour, cache HIT/MISS/etc, software name and version
head -n 100000 /var/log/nginx/access.log | awk '{print $4, $6, $13}' | cut -c1-15,22- | sort | uniq -c | sort -n
To extract data from the centralized log database on monitoring.ooni.org 🖥 you can use:
SELECT message FROM logsWHERE SYSLOG_IDENTIFIER = 'oohelperd'ORDER BY __REALTIME_TIMESTAMP DESCLIMIT 10note The table is indexed by
__REALTIME_TIMESTAMP. Limiting the range by time can significantly increase query performance.
See Selecting test helper for rotation 🐞
Measurement drop tutorial
This tutorial provides examples on how to investigate a drop in measurements. It is based on an incident where a drop in measurement was detected and the cause was not immediately clear.
It is not meant to be a step-by-step runbook but rather give hints on what data to look for, how to generate charts and identify the root cause of an incident.
A dedicated issue can be used to track the incident and the investigation effort and provide visibility: https://github.com/ooni/sysadmin/blob/master/.github/ISSUE_TEMPLATE/incident.md The issue can be filed during or after the incident depending on urgency.
Some of the examples below come from https://jupyter.ooni.org/notebooks/notebooks/android_probe_release_msm_drop_investigation.ipynb During an investigation it can be good to create a dedicated Jupyter notebook.
We started with reviewing:
- https://jupyter.ooni.org/view/notebooks/jupycron/autorun_android_probe_release.html No issues detected as the charts show a short timespan.
- The charts on Test helpers dashboard 📊. No issues detected here.
- The API and fastpath 📊 dashboard. No issues detected here.
- The Long term measurements prediction notebook 📔 The decrease was clearly showing.
Everything looked OK in terms of backend health. We then generated the following charts.
The chunks of Python code below are meant to be run in Jupyter Notebook 🔧 and are mostly “self-contained”. To be used you only need to import the Ooniutils microlibrary 💡:
%run ooniutils.ipynbThe “t” label is commonly used on existing notebooks to refer to hour/day/week time slices.
We want to plot how many measurements we are receiving from Ooniprobe Android in unattended runs, grouped by day and by software_version.
The last line generates an area chart using Altair. Notice that the x and y and color parameters match the 3 columns extracted by the SELECT.
The GROUP BY is performed on 2 of those 3 columns, while COUNT(*) is counting how many measurements exist in each t/software_version “bucket”.
The output of the SQL query is just a dataframe with 3 columns. There is no need to pivot or reindex it as Altair does the data transformation required.
note Altair refuses to process dataframes with more than 5000 rows.
x = click_query(""" SELECT toStartOfDay(toStartOfWeek(measurement_start_time)) AS t, software_version, COUNT(*) AS msm_cnt FROM fastpath WHERE measurement_start_time > today() - interval 3 month AND measurement_start_time < today() AND software_name = 'ooniprobe-android-unattended' GROUP BY t, software_version""")alt.Chart(x).mark_area().encode(x='t', y='msm_cnt', color='software_version').properties(width=1000, height=200, title="Android unattended msm cnt")The generated chart was:
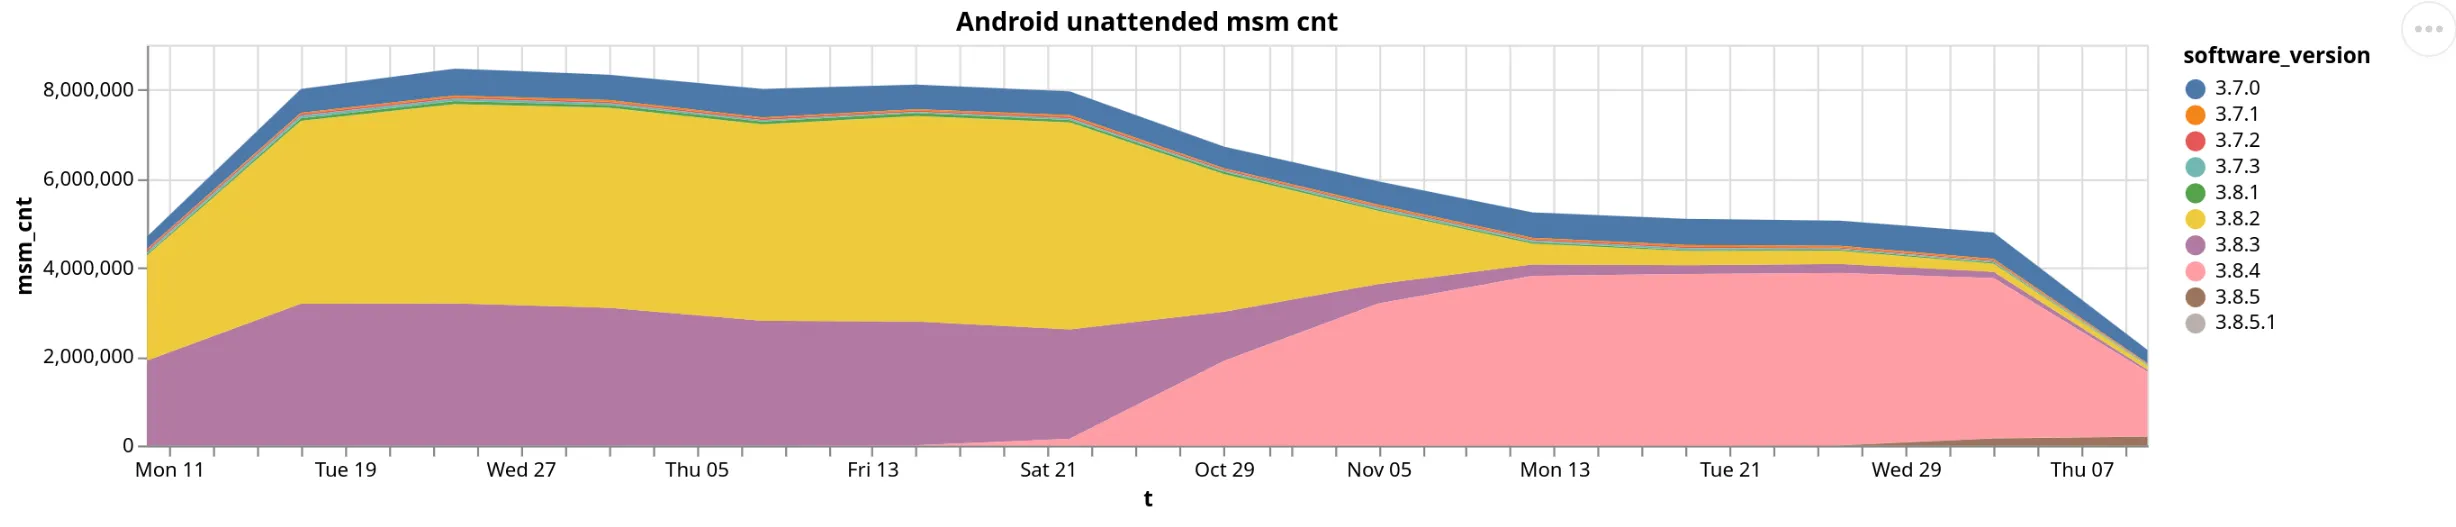
From the chart we concluded that the overall number of measurements have been decreasing since the release of a new version.
We also re-ran the plot by filtering on other software_name values and saw no other type of probe was affected.
note Due to a limitation in Altair, when grouping time by week use
toStartOfDay(toStartOfWeek(measurement_start_time)) AS t
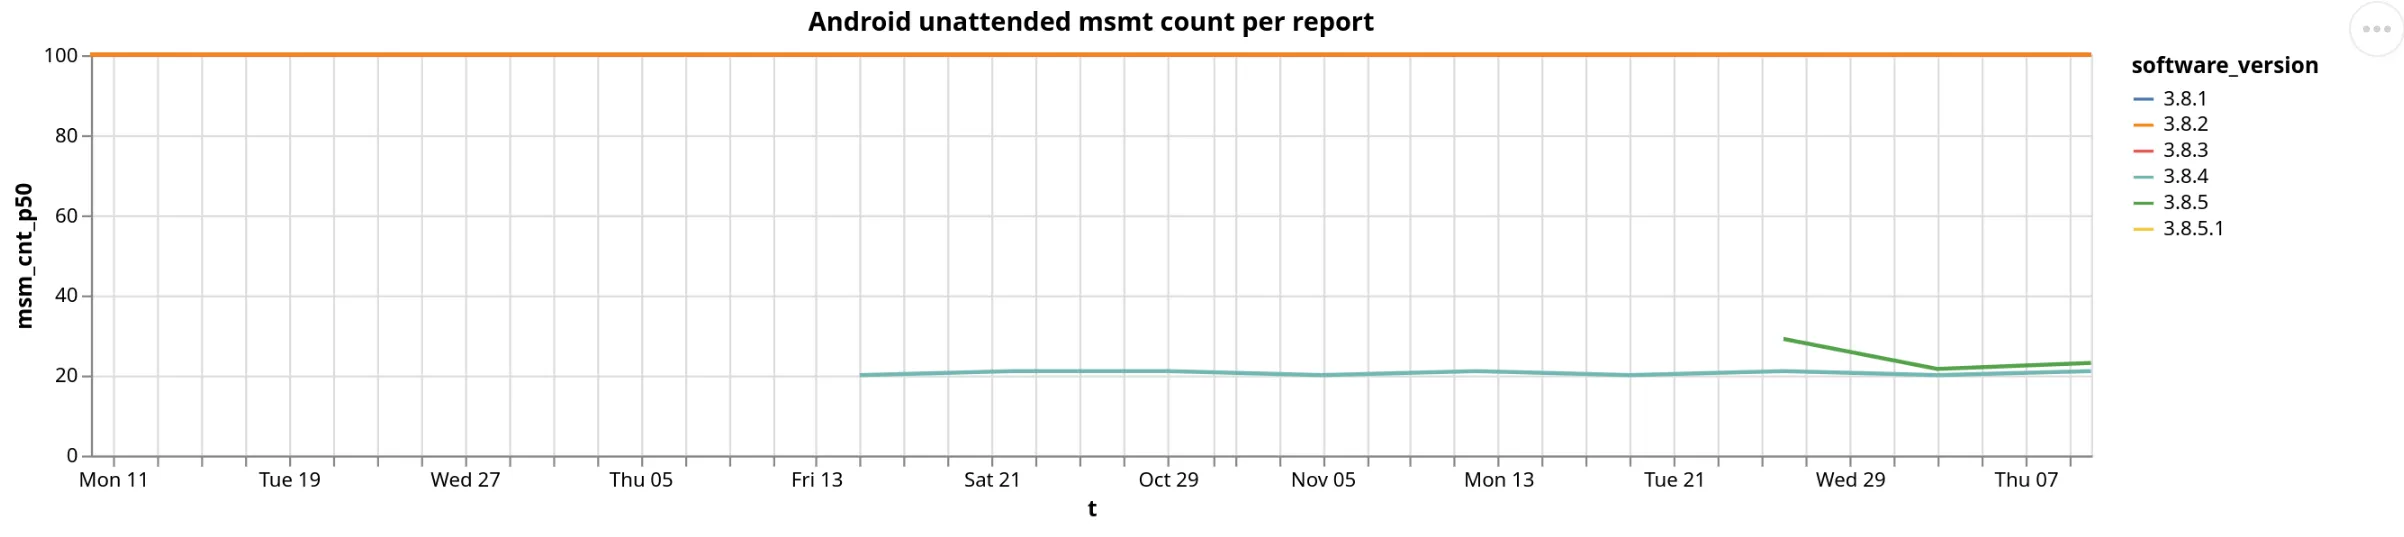
Then we wanted to measure how many measurements are being collected during each web_connectivity test run.
This is to understand if probes are testing less measurements in each run.
The following Python snippet uses nested SQL queries. The inner query groups measurements by time, software_version and report_id,
and counts how many measurements are related to each report_id.
The outer query “ignores” the report_id value and quantile() is used to extract the 50 percentile of msm_cnt.
note The use of double
%%inLIKEis required to escape the%wildcard. The wildcard is used to match any amount of characters.
x = click_query(""" SELECT t, quantile(0.5)(msm_cnt) AS msm_cnt_p50, software_version FROM ( SELECT toStartOfDay(toStartOfWeek(measurement_start_time)) AS t, software_version, report_id, COUNT(*) AS msm_cnt FROM fastpath WHERE measurement_start_time > today() - interval 3 month AND test_name = 'web_connectivity' AND measurement_start_time < today() AND software_name = 'ooniprobe-android-unattended' AND software_version LIKE '3.8%%' GROUP BY t, software_version, report_id ) GROUP BY t, software_version""")alt.Chart(x).mark_line().encode(x='t', y='msm_cnt_p50', color='software_version').properties(width=1000, height=200, title="Android unattended msmt count per report")We also compared different version groups and different software_name.
The output shows that indeed the number of measurements for each run is significantly lower for the newly released versions.
To update the previous Python snippet to group measurements by a different field, change software_version into the new column name.
For example use probe_cc to show a chart with a breakdown by probe country name. You should change software_version once in each SELECT part,
then in the last two GROUP BY, and finally in the color line at the bottom.
We did such change to confirm that all countries were impacted in the same way. (The output is not included here as not remarkable)
Also, mark_line on the bottom line is used to create line charts. Switch it to mark_area to generate stacked area charts.
See the previous two charts as examples.
We implemented a change to the API to improve logging the list of tests returned at check-in: https://github.com/ooni/backend/pull/781
and reviewed monitored the logs using sudo journalctl -f -u ooni-api.
The output showed that the API is very often returning 100 URLs to probes.
We then ran a similar query to extract the test duration time by calculating
MAX(measurement_start_time) - MIN(measurement_start_time) AS delta for each report_id value:
x = click_query(""" SELECT t, quantile(0.5)(delta) AS deltaq, software_version FROM ( SELECT toStartOfDay(toStartOfWeek(measurement_start_time)) AS t, software_version, report_id, MAX(measurement_start_time) - MIN(measurement_start_time) AS delta FROM fastpath WHERE measurement_start_time > today() - interval 3 month AND test_name = 'web_connectivity' AND measurement_start_time < today() AND software_name = 'ooniprobe-android-unattended' AND software_version LIKE '3.8%%' GROUP BY t, software_version, report_id ) GROUP BY t, software_version""")alt.Chart(x).mark_line().encode(x='t', y='deltaq', color='software_version').properties(width=1000, height=200, title="Android unattended test run time")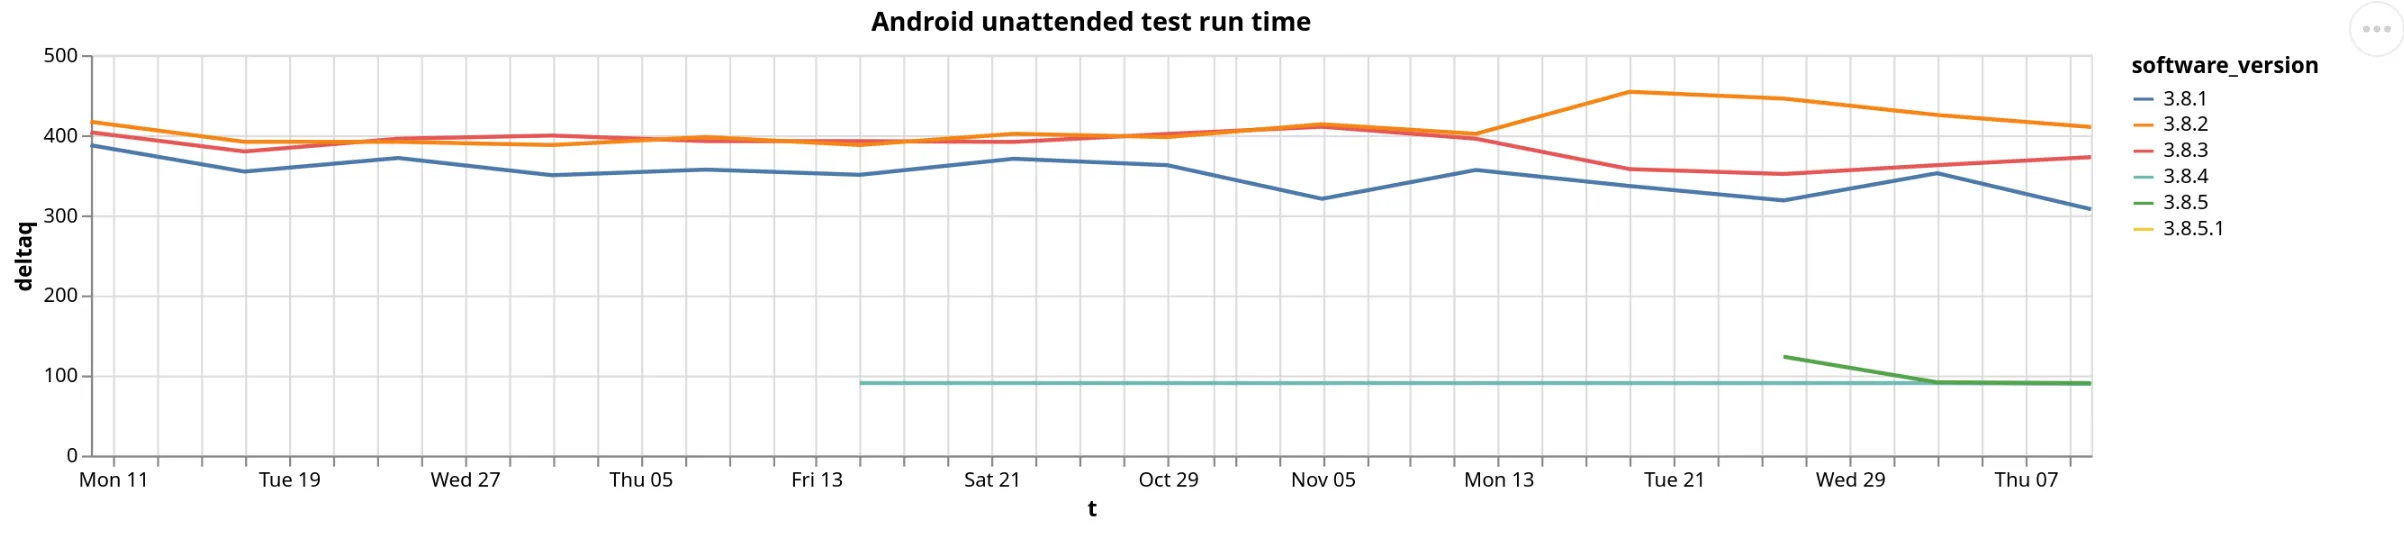
The chart showed that the tests are indeed running for a shorter amount of time.
note Percentiles can be more meaningful then averages. To calculate quantiles in ClickHouse use
quantile(<fraction>)(<column_name>).
Example:
quantile(0.1)(delta) AS deltaq10Wondering if the slowdown was due to slower measurement execution or other issues, we also generated a table as follows.
note Showing color bars allows to visually inspect tables more quickly. Setting the axis value to
0,1orNonehelps readability:y.style.bar(axis=None)
Notice the delta / msmcnt AS seconds_per_msm calculation:
y = click_query("""    SELECT        quantile(0.1)(delta) AS deltaq10,        quantile(0.3)(delta) AS deltaq30,        quantile(0.5)(delta) AS deltaq50,        quantile(0.7)(delta) AS deltaq70,        quantile(0.9)(delta) AS deltaq90,
        quantile(0.5)(seconds_per_msm) AS seconds_per_msm_q50,        quantile(0.5)(msmcnt) AS msmcnt_q50,
    software_version, software_name    FROM (        SELECT            software_version, software_name,            report_id,            MAX(measurement_start_time) - MIN(measurement_start_time) AS delta,            count(*) AS msmcnt,            delta / msmcnt AS seconds_per_msm        FROM fastpath        WHERE measurement_start_time > today() - interval 3 month        AND test_name = 'web_connectivity'        AND measurement_start_time < today()        AND software_name IN ['ooniprobe-android-unattended', 'ooniprobe-android']        AND software_version LIKE '3.8%%'        GROUP BY software_version, report_id, software_name    ) GROUP BY software_version, software_name    ORDER by software_version, software_name ASC""")y.style.bar(axis=None)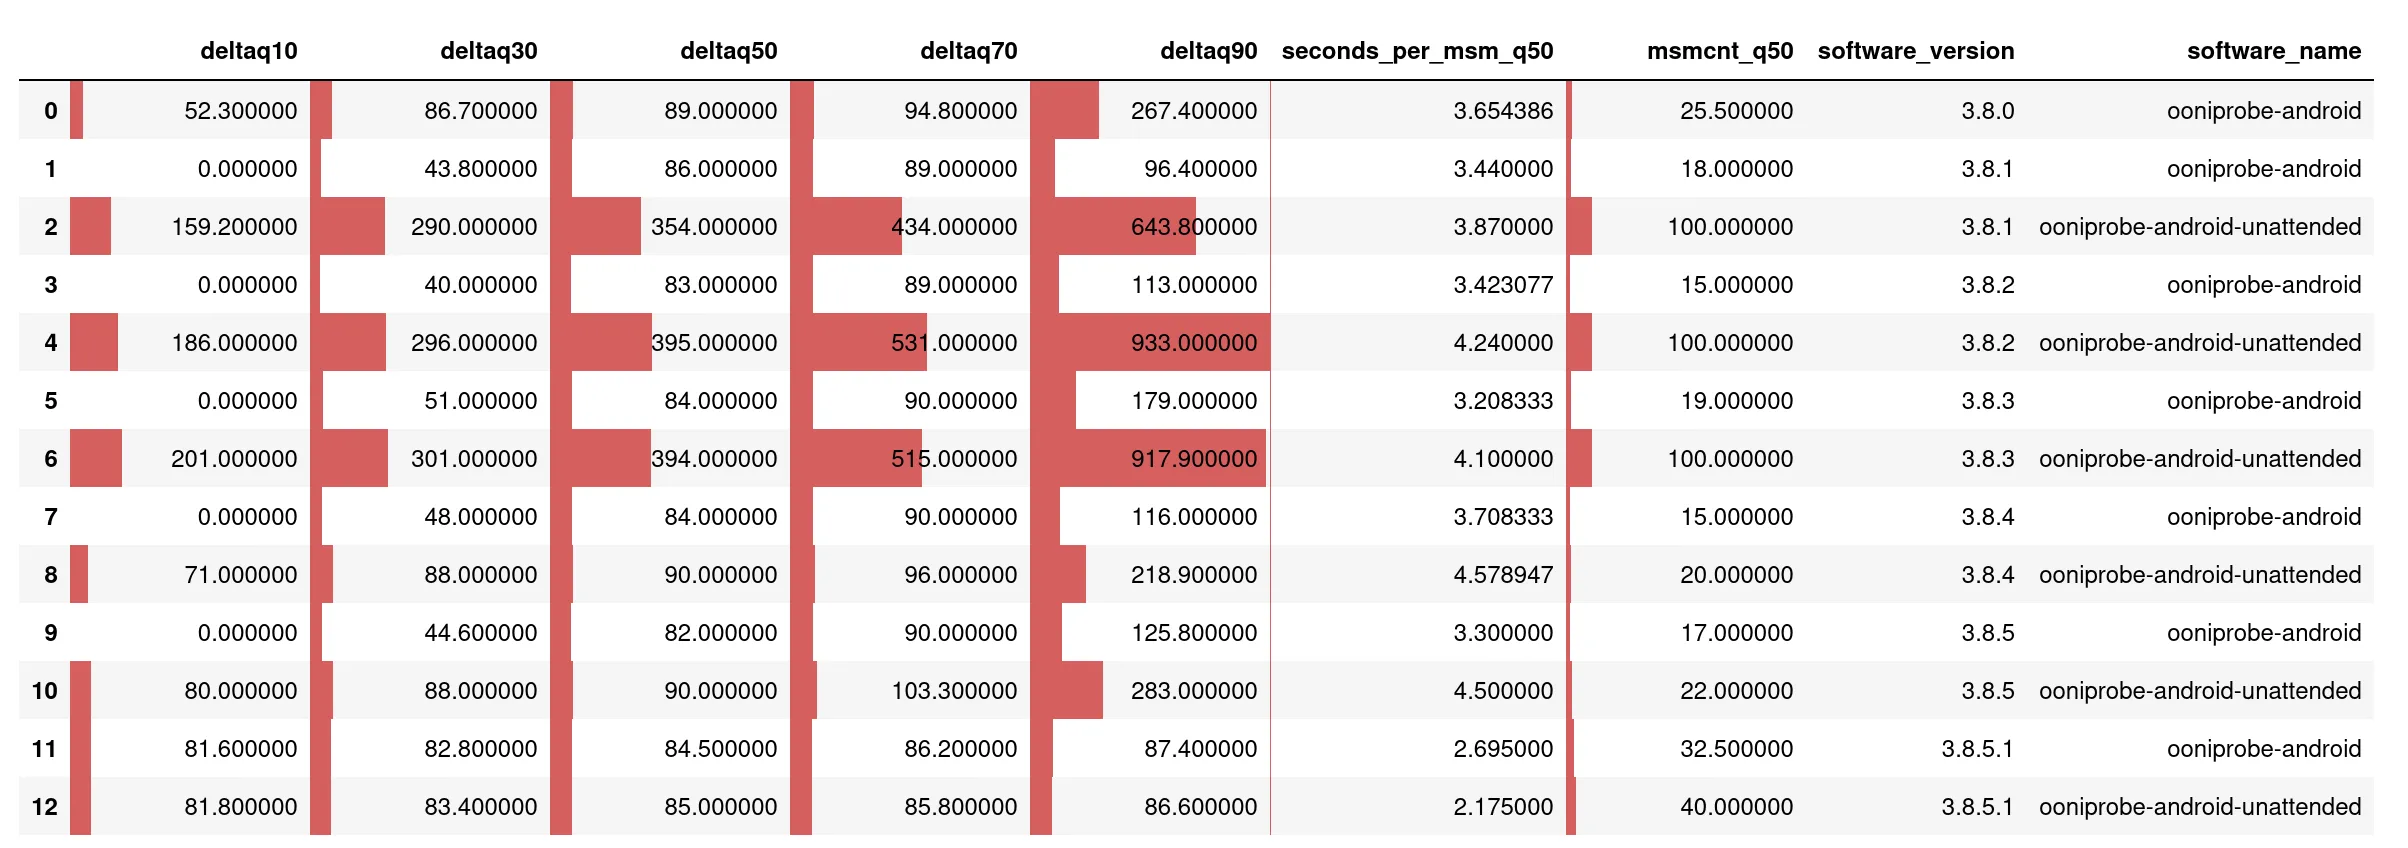
In the table we looked at the seconds_per_msm_q50 column: the median time for running each test did not change significantly.
To summarize:
- The backend appears to deliver the same amount of URLs to the Probes as usual.
- The time required to run each test is rougly the same.
- Both the number of measurements per run and the run time decreased in the new releases.
Weekly measurements review runbook
On a daily or weekly basis the following dashboards and Jupyter notebooks can be reviewed to detect unexpected patterns in measurements focusing on measurement drops, slowdowns or any potential issue affecting the backend infrastructure.
When browsing the dashboards expand the time range to one year in order to spot long term trends. Also zoom in to the last month to spot small glitches that could otherwise go unnoticed.
Review the API and fastpath 📊 dashboard for the production backend host[s] for measurement flow, CPU and memory load, timings of various API calls, disk usage.
Review the Incoming measurements notebook 📔 for unexpected trends.
Quickly review the following dashboards for unexpected changes:
- Long term measurements prediction notebook 📔
- Test helpers dashboard 📊
- Test helper failure rate notebook 📔
- Database backup dashboard 📊
- GeoIP MMDB database dashboard 📊
- GeoIP dashboard 📊
- Fingerprint updater dashboard 📊
- ASN metadata updater dashboard 📊
Also check https://jupyter.ooni.org/view/notebooks/jupycron/summary.html for glitches like notebooks not being run etc.
Grafana backup runbook
This runbook describes how to back up dashboards and alarms in Grafana. It does not include backing up datapoints stored in Prometheus 🔧.
The Grafana SQLite database can be dumped by running:
sqlite3 -line /var/lib/grafana/grafana.db '.dump' > grafana_dump.sqlFuture implementation is tracked in: Implement Grafana dashboard and alarms backup 🐞
Grafana editing
This runbook describes adding new dashboards, panels and alerts in Grafana 🔧
To add a new dashboard use this https://grafana.ooni.org/dashboard/new?orgId=1
To add a new panel to an existing dashboard load the dashboard and then click the “Add” button on the top.
Many dashboards use variables. For example, on
https://grafana.ooni.org/d/l-MQSGonk/api-and-fastpath-multihost?orgId=1
the variables $host and $avgspan are set on the top left and used in
metrics like:
avg_over_time(netdata_disk_backlog_milliseconds_average{instance="$host:19999"}[$avgspan])Managing Grafana alert rules
Alert rules can be listed at https://grafana.ooni.org/alerting/list
note The list also shows which alerts are currently alarming, if any.
Click the arrow on the left to expand each alerting rule.
The list shows:
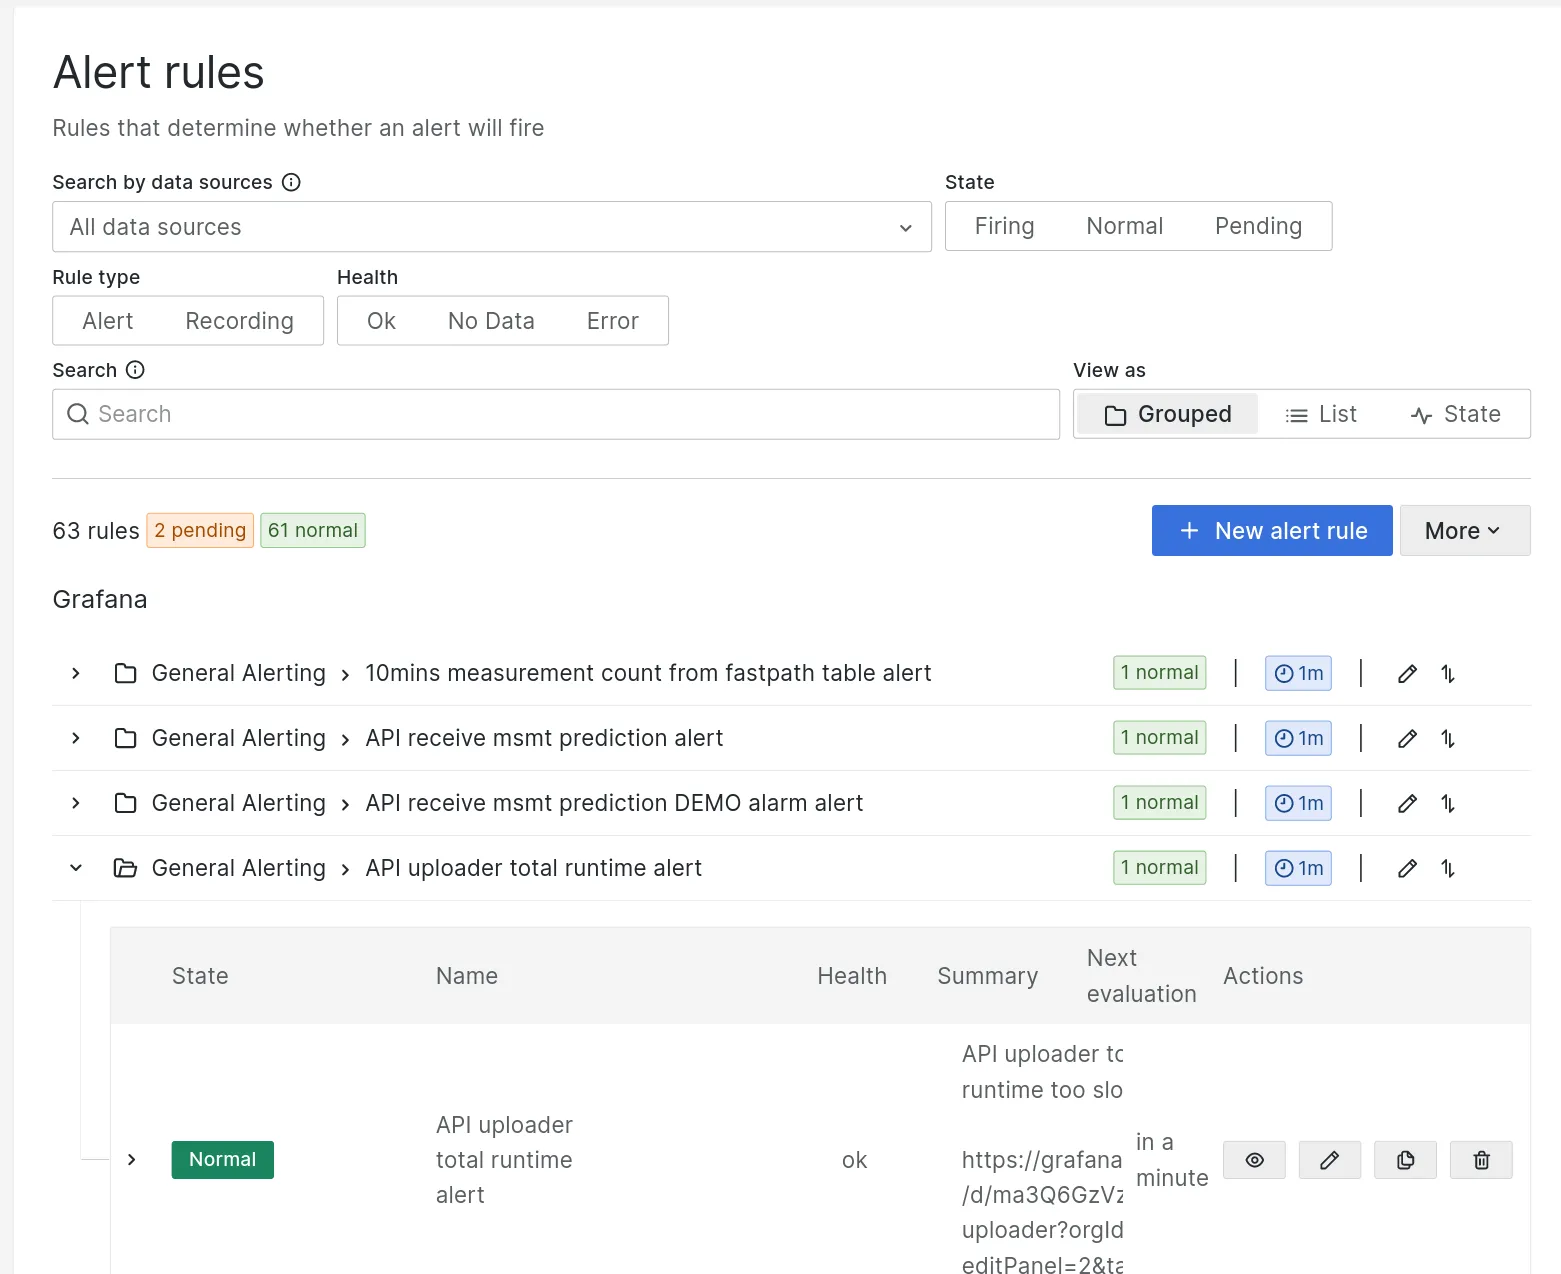
note When creating alerts it can be useful to add full URLs linking to dashboards, runbooks etc.
To stop notifications create a “silence” either:
-
by further expanding an alert rule (see below) and clicking the “Silence” button
-
by inputting it in https://grafana.ooni.org/alerting/silences
Screenshot:
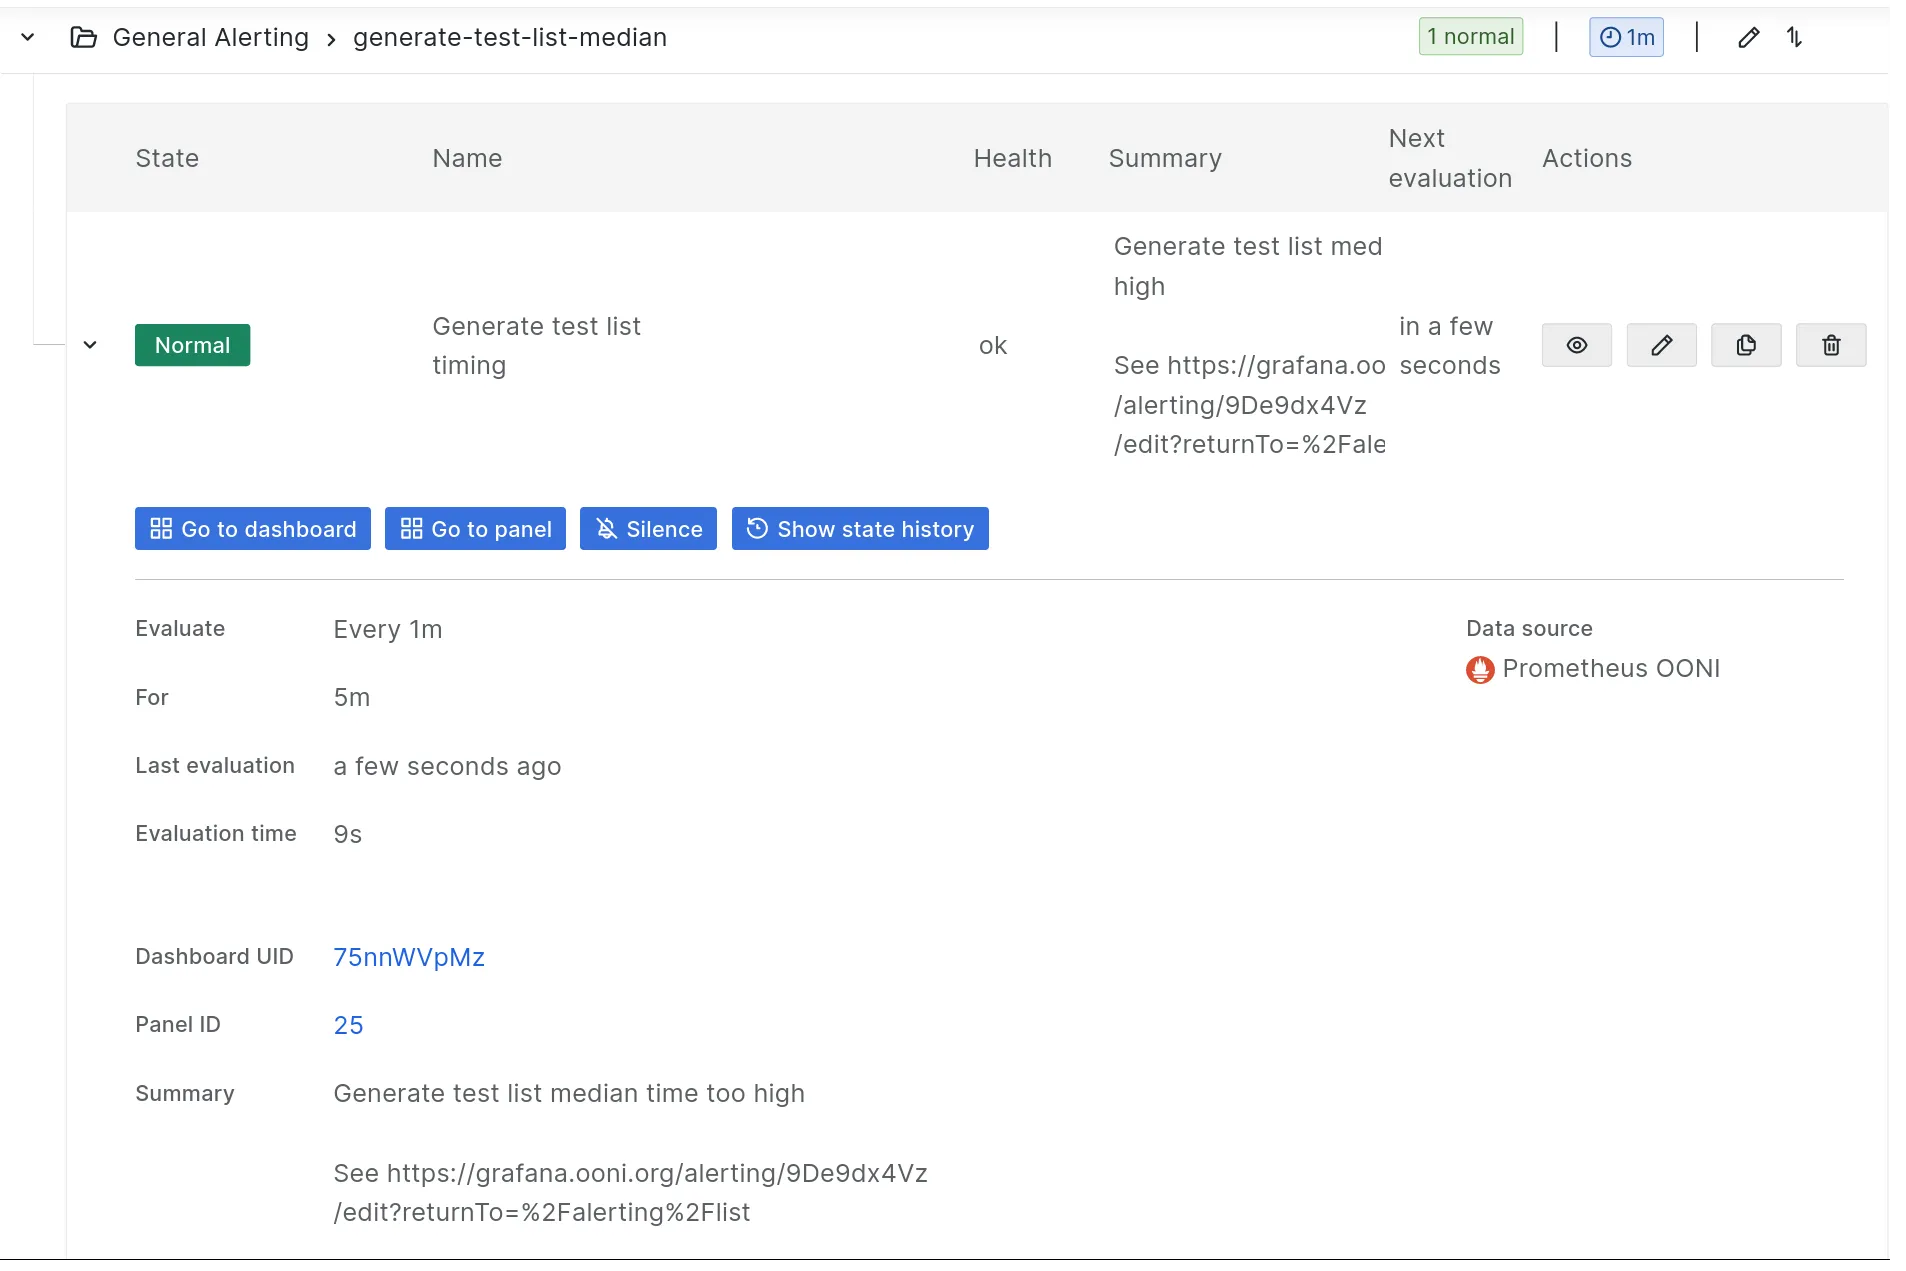
Additionally, the “Show state history” button is useful especially with flapping alerts.
Geolocation script
The following script can be used to compare the geolocation reported by
the probes submitting measurements compared to the geolocation of the
/24 subnet the probe is coming from. It is meant to be run on
backend-fsn.ooni.org 🖥.
##!/usr/bin/env python3
from time import sleep
import systemd.journalimport geoip2.database  # type: ignore
asnfn = "/var/lib/ooniapi/asn.mmdb"ccfn = "/var/lib/ooniapi/cc.mmdb"geoip_asn_reader = geoip2.database.Reader(asnfn)geoip_cc_reader = geoip2.database.Reader(ccfn)

def follow_journal():    journal = systemd.journal.Reader()    #journal.seek_tail()    journal.get_previous()    journal.add_match(_SYSTEMD_UNIT="nginx.service")    while True:        try:            event = journal.wait(-1)            if event == systemd.journal.APPEND:                for entry in journal:                    yield entry["MESSAGE"]        except Exception as e:            print(e)            sleep(0.1)

def geolookup(ipaddr: str):    cc = geoip_cc_reader.country(ipaddr).country.iso_code    asn = geoip_asn_reader.asn(ipaddr).autonomous_system_number    return cc, asn

def process(rawmsg):    if ' "POST /report/' not in rawmsg:        return    msg = rawmsg.strip().split()    ipaddr = msg[2]    ipaddr2 = msg[3]    path = msg[8][8:]    tsamp, tn, probe_cc, probe_asn, collector, rand = path.split("_")    geo_cc, geo_asn = geolookup(ipaddr)    proxied = 0    probe_type = rawmsg.rsplit('"', 2)[-2]    if "," in probe_type:        return    if ipaddr2 != "0.0.0.0":        proxied = 1        # Probably CloudFront, use second ipaddr        geo_cc, geo_asn = geolookup(ipaddr2)
    print(f"{probe_cc},{geo_cc},{probe_asn},{geo_asn},{proxied},{probe_type}")

def main():    for msg in follow_journal():        if msg is None:            break        try:            process(msg)        except Exception as e:            print(e)            sleep(0.1)

if __name__ == "__main__":    main()
Test list prioritization monitoring
The following script monitors prioritized test list for changes in URLs for a set of countries. Outputs StatsS metrics.
note The prioritization system has been modified to work on a granularity of probe_cc + probe_asn rather than whole countries.
Country-wise changes might be misleading. The script can be modified to filter for a set of CCs+ASNs.
##!/usr/bin/env python3
from time import sleepimport urllib.requestimport json
import statsd  # debdeps: python3-statsd
metrics = statsd.StatsClient("127.0.0.1", 8125, prefix="test-list-changes")
CCs = ["GE", "IT", "US"]THRESH = 100

def peek(cc, listmap) -> None:    url = f"https://api.ooni.io/api/v1/test-list/urls?country_code={cc}&debug=True"    res = urllib.request.urlopen(url)    j = json.load(res)    top = j["results"][:THRESH]  # list of dicts    top_urls = set(d["url"] for d in top)
    if cc in listmap:        old = listmap[cc]        changed = old.symmetric_difference(top_urls)        tot_cnt = len(old.union(top_urls))        changed_ratio = len(changed) / tot_cnt * 100        metrics.gauge(f"-{cc}", changed_ratio)
    listmap[cc] = top_urls

def main() -> None:    listmap = {}    while True:        for cc in CCs:            try:                peek(cc, listmap)            except Exception as e:                print(e)            sleep(1)        sleep(60 * 10)

if __name__ == "__main__":    main()
Recompressing postcans on S3
The following script can be used to compress .tar.gz files in the S3 data bucket. It keeps a copy of the original files locally as a backup. It terminates once a correctly compressed file is found. Running the script on an AWS host close to the S3 bucket can significantly speed up the process.
Tested with the packages:
- python3-boto3 1.28.49+dfsg-1
- python3-magic 2:0.4.27-2
Set the ACCESS_KEY and SECRET_KEY environment variables. Update the PREFIX variable as needed.
##!/usr/bin/env python3from os import getenv, renamefrom sys import exitimport boto3import gzipimport magic
BUCKET_NAME = "ooni-data-eu-fra-test"## BUCKET_NAME = "ooni-data-eu-fra"PREFIX = "raw/2021"
def fetch_files():    s3 = boto3.client(        "s3",        aws_access_key_id=getenv("ACCESS_KEY"),        aws_secret_access_key=getenv("SECRET_KEY"),    )    cont_token = None    while True:        kw = {} if cont_token is None else dict(ContinuationToken=cont_token)        r = s3.list_objects_v2(Bucket=BUCKET_NAME, Prefix=PREFIX, **kw)        cont_token = r.get("NextContinuationToken", None)        for i in r.get("Contents", []):            k = i["Key"]            if k.endswith(".tar.gz"):                fn = k.rsplit("/", 1)[-1]                s3.download_file(BUCKET_NAME, k, fn)                yield k, fn        if cont_token is None:            return
def main():    s3res = session = boto3.Session(        aws_access_key_id=getenv("ACCESS_KEY"),        aws_secret_access_key=getenv("SECRET_KEY"),    ).resource("s3")    for s3key, fn in fetch_files():        ft = magic.from_file(fn)        if "tar archive" not in ft:            print(f"found {ft} at {s3key}")            # continue   # simply ignore already compressed files            exit()      # stop when compressed files are found        tarfn = fn[:-3]        rename(fn, tarfn)  # keep the local file as a backup        with open(tarfn, "rb") as f:            inp = f.read()            comp = gzip.compress(inp, compresslevel=9)        ratio = len(inp) / len(comp)        del inp        print(f"uploading {s3key}   compression ratio {ratio}")        obj = s3res.Object(BUCKET_NAME, s3key)        obj.put(Body=comp)        del comp
main()
Github issues
Selecting test helper for rotation
See https://github.com/ooni/backend/issues/721
Document Tor targets
See https://github.com/ooni/backend/issues/761
Disable unnecessary ClickHouse system tables
See https://github.com/ooni/backend/issues/779
Feed fastpath from JSONL
See https://github.com/ooni/backend/issues/778