API and Services
Systemd timers
Some backend components like the API and Fastpath run as daemons. Many other run as Systemd timers at various intervals.
The latter approach ensures that a component will start again at the next time interval even if the previous run crashed out. This provides a moderate reliability benefit at the expense of having to perform initialization and shutdown at every run.
To show the existing timers and their next start time run:
systemctl list-timersSummary of timers
Here is a summary of the most important timers used in the backend:
UNIT ACTIVATESdehydrated.timer dehydrated.servicedetector.timer detector.serviceooni-api-uploader.timer ooni-api-uploader.serviceooni-db-backup.timer ooni-db-backup.serviceooni-download-geoip.timer ooni-download-geoip.serviceooni-rotation.timer ooni-rotation.serviceooni-update-asn-metadata.timer ooni-update-asn-metadata.serviceooni-update-citizenlab.timer ooni-update-citizenlab.serviceooni-update-fingerprints.timer ooni-update-fingerprints.serviceOoni-developed timers have a matching unit file with .service extension.
To show the existing timers and their next start time run:
systemctl list-timersThis can be useful for debugging.
Dehydrated timer
Runs the Dehydrated ACME tool, see Dehydrated ⚙
is a simple script that provides ACME support for Letsencrypt. It’s integrated with Nginx or HaProxy with custom configuration or a small script as “glue”.
Detector timer
Runs the social media blocking event detector ⚙. It is installed by the detector package 📦.
ooni-api-uploader timer
Runs the Measurement uploader ⚙. It is installed by the
analysis package 📦. Runs /usr/bin/ooni_api_uploader.py
ooni-db-backup timer
Runs the Database backup tool ⚙ as
/usr/bin/ooni-db-backup Also installed by the
analysis package 📦.
ooni-download-geoip timer
Fetches GeoIP databases, installed by the ooni-api ⚙. Runs
/usr/bin/ooni_download_geoip.py
Monitored with the GeoIP dashboard 📊
See GeoIP downloader ⚙
ooni-rotation timer
Runs the test helper rotation script, installed by the
analysis package 📦. Runs /usr/bin/rotation
ooni-update-asn-metadata timer
Fetches ASN 💡 metadata, installed by the
analysis package 📦. Runs /usr/bin/analysis --update-asnmeta
ooni-update-citizenlab
Fetches CitizenLab data from GitHub, installed by the
analysis package 📦. Runs /usr/bin/analysis --update-citizenlab
ooni-update-fingerprints
Fetches fingerprints from GitHub, installed by the
analysis package 📦. Runs /usr/bin/analysis --update-fingerprints
Nettest names
Nettest specifications are kept at https://github.com/ooni/spec/tree/master/nettests
Web connectivity test
Nettest for HTTP/HTTPS connectivity named web_connectivity.
See https://github.com/ooni/spec/blob/master/nettests/ts-017-web-connectivity.md
Signal test
Nettest for Signal Private Messenger named signal
See https://github.com/ooni/spec/blob/master/nettests/ts-029-signal.md
API
The API provides entry points used by the probes, Explorer Test List Editor 🖱 and other UIs, and researchers.
Entry points under /api/v1/ are meant for public consumption and
versioned. Those under /api/_/ are for internal use.
The API is versioned. Access is rate limited based on source IP address and access tokens. See Rate limiting and quotas 🐝 for details.
due to the computational cost of running heavy queries on the database. The API entry points are documented at apidocs using flasgger. A swagger JSON specification is published at https://api.ooni.io/apispec_1.json
The file is also tracked at https://github.com/ooni/backend/blob/0ec9fba0eb9c4c440dcb7456f2aab529561104ae/api/docs/apispec.json It is checked for consistency by CI in the API end-to-end test 💡, see https://github.com/ooni/backend/blob/0ec9fba0eb9c4c440dcb7456f2aab529561104ae/.github/workflows/test_new_api.yml#L27
To regenerate the spec file when implementing changes to the API use: https://github.com/ooni/backend/blob/0ec9fba0eb9c4c440dcb7456f2aab529561104ae/api/tools/check_apispec_changes
Before diving into the API codebase it’s worth glancing at commonly used functions:
URL parameter parsing utilities at https://github.com/ooni/backend/blob/0ec9fba0eb9c4c440dcb7456f2aab529561104ae/api/ooniapi/urlparams.py
Caching functions cachedjson and nocachejson at
https://github.com/ooni/backend/blob/0ec9fba0eb9c4c440dcb7456f2aab529561104ae/api/ooniapi/utils.py#L18
Various database access functions query_click, insert_click at
https://github.com/ooni/backend/blob/0ec9fba0eb9c4c440dcb7456f2aab529561104ae/api/ooniapi/database.py#L73
API routes are mounted at: https://github.com/ooni/backend/blob/0ec9fba0eb9c4c440dcb7456f2aab529561104ae/api/ooniapi/database.py#L73
Functions related to initialization of the service and configurating rate limiting: https://github.com/ooni/backend/blob/0ec9fba0eb9c4c440dcb7456f2aab529561104ae/api/ooniapi/app.py
note Caching can be a source of bugs: enabling or disabling it explicitly in the codebase (instead of relying on defaults in Nginx/HaProxy) improves readability.
important Various queries are designed to support active/standby or active/active database setups. See Overall design 💡 for details.
API cache
The API uses cacheing functions provided by Nginx ⚙.
Caching functions cachedjson and nocachejson are defined at
https://github.com/ooni/backend/blob/0ec9fba0eb9c4c440dcb7456f2aab529561104ae/api/ooniapi/utils.py#L18
ASN
Autonomous System Number, described at
https://en.wikipedia.org/wiki/Autonomous_system_(Internet) It is
stored as probe_asn in measurements, and as probe_asn column in the
fastpath table ⛁. Used as a search term in
Searching for measurements and Aggregation and MAT 🐝
The lookup system in the API is updated by the ASN metadata updater ⚙. See ASN metadata updater dashboard 📊 and ooni-update-asn-metadata timer.
Geolocation
The API and implements geolocation in order to identify the ASN 💡
Auth
This module implements browser authentication and user accounts. See Probe services 🐝 for probe authentication.
It is designed to fit the following requirements:
-
Never store users email address centrally nor IP addresses nor passwords
-
Verify email to limit spambots. Do not use CAPCHAs or other 3rd party services
-
Support multiple sessions and multiple devices, ability to register multiple times
-
Do not leak the existence of absence of accounts for a given email address
Workflow:
-
To register the UIs call https://api.ooni.io/apidocs/#/default/post_api_v1_user_register using an email address and the user receives a temporary login link by email
-
Upon clicking on the link the UIs call https://api.ooni.io/apidocs/#/default/get_api_v1_user_login and receive a long-lived JWT in a cookie
-
The UIs call any API entry point sending the JWT cookie
-
The UIs call https://api.ooni.io/apidocs/#/default/get_api_v1_user_refresh_token as needed to refresh the JWT
The API als provides entry points to:
-
Get account metadata https://api.ooni.io/apidocs/#/default/get_api___account_metadata
-
Get role for an existing account https://api.ooni.io/apidocs/#/default/get_api_v1_get_account_role__email_address_
-
Set account roles https://api.ooni.io/apidocs/#/default/post_api_v1_set_account_role
-
Expunge sessions (see below) https://api.ooni.io/apidocs/#/default/post_api_v1_set_session_expunge
Browsers sessions can be expunged to require users to log in again. This can be used if an account role needs to be downgraded or terminated urgently.
important Account IDs are not the same across test and production instances.
This is due to the use of a configuration variable
ACCOUNT_ID_HASHING_KEY in the hashing of the email address. The
parameter is read from the API configuration file. The values are
different across deployment stages as a security feature.
Also see Creating admin API accounts 📒 for more details.
Measurements
This module primarily provides entry points to access measurements, typically used by Explorer and sometimes directly by users.
Mounted under /api/v1/measurement/
Searching for measurements
The entry point https://api.ooni.io/apidocs/#/default/get_api_v1_measurements provides measurement searching and listing.
It is primarily used by https://explorer.ooni.org/search
Getting measurement bodies
Various API entry points allow accessing measurement bodies. Typically
the lookup is done by measurement_uid:
-
https://api.ooni.io/apidocs/#/default/get_api_v1_measurement__measurement_uid_
-
https://api.ooni.io/apidocs/#/default/get_api_v1_raw_measurement
-
https://api.ooni.io/apidocs/#/default/get_api_v1_measurement_meta
For legacy reasons measurements can also be accessed by report_id +
input instead of measurement_uid
important Accessing measurements by
report_id+inputdoes not guarantee uniqueness.
The lookup process can access measurement bodies from multiple locations. The lookup is performed in different order for different measurements based on the likelihood of success:
-
Scan the local spool directory
/var/lib/ooniapi/measurements/incoming/for fresh measurements -
Scan other API hosts (if any) for fresh measurements. This is required to support active/active backend deployments.
-
Lookup the measurement data in jsonl table ⛁ and then fetch the required JSONL files 💡 from S3 data bucket 💡 and extract the content.
Performance considerations
Fetching data from the S3 data bucket 💡 bucket can be resource-intensive. However:
-
Very recent measurements are likely to be found in the local on-disk queue instead of having to fetch them from S3. See Measurement uploader ⚙ for details.
-
Frequently accessed measurements benefit from the API cache 💡.
-
Measurement bodies are rarely accessed. The overall amount of measurements is too large for users to explore a significant fraction through the web UIs.
Possible improvements are:
-
Compress JSONL files using https://github.com/facebook/zstd with high compression rates
-
Use a seekable format and store the measurement location in the JSONL file in the jsonl table ⛁ expressed in bytes. See https://github.com/facebook/zstd/blob/dev/contrib/seekable_format/README.md
Measurement feedback
This part of the API is used to collect and serve user feedback on measurements. It uses msmt_feedback table ⛁ and provides:
-
Getting feedback for an existing measurement https://api.ooni.io/apidocs/#/default/get_api___measurement_feedback__measurement_uid_
-
Submitting new feedback https://api.ooni.io/apidocs/#/default/post_api___measurement_feedback
All users can access feedbacks but only authenticated ones can submit their feedbacks.
Users can submit only one feedback for each measurement. When the submission entry point is called a second time for the same measurements the previous feedback is overwritten using database row deduplication.
Valid feedback statuses are:
blockedblocked.blockpageblocked.blockpage.httpblocked.blockpage.dnsblocked.blockpage.server_sideblocked.blockpage.server_side.captchablocked.dnsblocked.dns.inconsistentblocked.dns.nxdomainblocked.tcpblocked.tlsokdowndown.unreachabledown.misconfiguredAggregation and MAT
The aggregation API leverages the OLAP features of ClickHouse ⚙ to provide summaries and statistics on measurements. It is primarily used by the MAT. It can also be used to implement other statistics in Explorer or accessed directly by researchers to extract data.
important Caching of this entry point should be implemented carefully as new measurements are constantly being inserted and old measurements might be occasionally reprocessed.
Also see Aggregation cache monitoring 🐍 and Investigating heavy aggregation queries runbook 📒.
Probe services
This part of the API is implemented in the probe_services.py module.
It provides entry points that are meant to be used exclusively by
probes.
Check-in
This entry point is the preferred way for probes to:
-
Geo-resolve their IP address to ASN 💡 and network name. See
-
Receive a list of URLs for Web connectivity test Ⓣ
-
Receive a list of test helpers
-
Set flags to implement incremental rollouts and A/B testing new features
See https://api.ooni.io/apidocs/#/default/post_api_v1_check_in
Test lists are prioritized based on the country code and ASN 💡 of the probes, as well as flags indicating if the probe is connected to WiFi and the battery is being charged.
Tor targets
Tor targets are served: at path /api/v1/test-list/tor-targets. See
https://api.ooni.io/apidocs/#/default/get_api_v1_test_list_tor_targets
They are read from a configuration file. The path is set in the main
configuration file under TOR_TARGETS_CONFFILE. It usually is
/etc/ooni/tor_targets.json.
To make changes in the Tor targets see the runbook Updating tor targets 📒
Test helpers list
This entry point provides a list of test helpers to the probes: https://api.ooni.io/apidocs/#/default/get_api_v1_test_helpers
important Test helpers addresses are served with a load-balancing algorithm. The amount requests per second they receive should be consistent across hosts, except for
0.th.ooni.org.
0.th.ooni.org is treated differently from other test helpers:
it receives less traffic to allow testing new releases with lower impact.
Miscellaneous probe configuration data
Various endpoints provide data to configure the probe:
-
https://api.ooni.io/apidocs/#/default/get_api_v1_test_list_psiphon_config
-
https://api.ooni.io/apidocs/#/default/post_bouncer_net_tests
Probe registration and login
Two entry points provide probe registration and login. The mechanism and the accounts are legacy and completely independent from Auth 🐝.
The workflows follow these steps:
-
A new probe registers and receives a
client_idtoken using https://api.ooni.io/apidocs/#/default/post_api_v1_register -
The token is stored permanently on the probe
-
The probe calls https://api.ooni.io/apidocs/#/default/post_api_v1_login when needed and receives a temporary token
-
The probe calls check-in supplying the temporary token
On backend-fsn.ooni.org 🖥 the two entry points are currently being redirected to a different host implementing https://orchestrate.ooni.io/ while other backend hosts are exposing the endpoints in the API.
important The probe authentication implemented in the API is not backward compatible with credentials already generated by Orchestrate and stored by existing probes.
Measurement submission
The probe services module also provides entry points to submit measurements. The submission is done in steps:
-
The probe opens a new report at https://api.ooni.io/apidocs/#/default/post_report
-
The probe submit one or more measurements with one HTTP POST each at https://api.ooni.io/apidocs/#/default/post_report__report_id_
-
The probe optionally closes the report using https://api.ooni.io/apidocs/#/default/post_reportreport_idclose Closing reports is currently unnecessary.
Robots.txt
Probe services also serve the robots.txt file at
https://api.ooni.io/robots.txt
https://api.ooni.io/apidocs/#/default/get_robots_txt
This is use to block or throttle search engines and other bots that in the past caused significant load on the API.
note some aggressive bots might ignore
robots.txt. See Limiting scraping 📒
https://api.ooni.io/apidocs/#/default/get_stats
Incident management
The incident management module implements ways for users to create, update and list incidents.
Related: https://docs.google.com/document/d/1TdMBWD45j3bx7GRMIriMvey72viQeKrx7Ad6DyboLwg/
Accounts with “admin” role can perform the same actions as regolar users and additionally can publish, unpublish and delete incidents.
All the routes related to this module are mounted under
/api/v1/incidents/:
-
Search and list incidents: https://api.ooni.io/apidocs/#/default/get_api_v1_incidents_search
-
Show an incident: https://api.ooni.io/apidocs/#/default/get_api_v1_incidents_show__incident_id_
-
Create or update an incident: https://api.ooni.io/apidocs/#/default/post_api_v1_incidents__action_ Search/list incidents with:
-
Filtering by domain/cc/asn/creator id/ and so on
-
Sort by creation/edit date, event date, and so on
Users can only update/delete incidents created by themselves. Admins can update/delete everything.
Incidents are stored in the incidents table ⛁
See Sources
Prioritization
This module implements reactive prioritization for URLs in the test list served to the probes.
/api/v1/check-in and /api/v1/test-list/urls provide dynamic URL
tests lists for Web connectivity test Ⓣ based on the
CitizenLab URL list and the measurements count from the last 7 days.
The prio.py module is used mainly by the Probe services 🐝 API
and secondarily by the private_api_check_in method in the
Private entry points 🐝.
For changing prioritization rules see Prioritization rules UI and Prioritization management 🐝
Ellipses represent data; rectangles represent processes. Purple components belong to the backend. Click on the image and then click on each shape to see related documentation.
In the diagram arrows show information flow.
The prioritization system implements a feedback mechanism to provide efficient coverage of URLs in Web connectivity test Ⓣ in ASN 💡 with low coverage.
Measurements from probes are received by the API ⚙, sent to the Fastpath ⚙ and then stored in the fastpath table. ClickHouse ⚙ automatically updates the counters_asn_test_list table ⛁ in real time. See the link for details on the table contents.
Later on probes call API entry points like https://api.ooni.io/apidocs/#/default/post_api_v1_check_in and receive new URLs (inputs) for Web connectivity test Ⓣ. The URLs are ordered according to the priorities set in the url_priorities table ⛁ and the amount of measurements gathered in the past days from probes in the same ASN 💡.
For debugging see https://api.ooni.io/apidocs/#/default/get_api___debug_prioritization and Test list prioritization monitoring 🐍
Priorities and weights
URLs have priorities based on the rules from the url_priorities table ⛁.
Prioritization rules can be viewed and edited by accounts with admin
rights on https://test-lists.ooni.org/prioritization
The compute_priorities function calculates priority and weight for each supplied URL.
Priorities are calculated by matching all the prioritization rules to each URL in the citizenlab table ⛁. They do not depend on the amount of past measurements.
Priorities values are relative, e.g. if one URL has a priority of 800 and another one has 200 the first should be measured 4 times more often than the latter.
The URLs sent to the probes are ordered from the most urgent to the
least urgent by calculating weights as priority / measurement count.
This is done with a granularity of a single country code +
ASN 💡 pair.
Probes start performing Web connectivity test Ⓣ from the top of the list.
You can inspect generated priorities with the Priorities and weights notebook 📔 or using the API at https://api.ooni.io/apidocs//default/get_api_v1_test_list_urls or https://api.ooni.io/apidocs//default/get_api___debug_prioritization e.g.:
$ curl -s 'https://api.ooni.io/api/v1/test-list/urls?country_code=IT&probe_asn=3269&debug=True' | jq -S | less
$ curl -s 'https://ams-pg-test.ooni.org/api/_/debug_prioritization?probe_cc=IT&probe_asn=3269&limit=9999' | jq -S | less
Private entry points
The private.py module provides many entry points not meant for public
consumption. They are not versioned, mounted under /api/_ and used
exclusively by:
Statistics and summaries, mainly for Explorer:
-
https://api.ooni.io/apidocs/#/default/get_api___asn_by_month
-
https://api.ooni.io/apidocs/#/default/get_api___circumvention_runtime_stats
-
https://api.ooni.io/apidocs/#/default/get_api___circumvention_stats_by_country
-
https://api.ooni.io/apidocs/#/default/get_api___countries_by_month
-
https://api.ooni.io/apidocs/#/default/get_api___country_overview
-
https://api.ooni.io/apidocs/#/default/get_api___domain_metadata
-
https://api.ooni.io/apidocs/#/default/get_api___global_overview
-
https://api.ooni.io/apidocs/#/default/get_api___global_overview_by_month
-
https://api.ooni.io/apidocs/#/default/get_api___network_stats
-
https://api.ooni.io/apidocs/#/default/get_api___test_coverage
-
https://api.ooni.io/apidocs/#/default/get_api___vanilla_tor_stats
-
https://api.ooni.io/apidocs/#/default/get_api___website_networks
-
https://api.ooni.io/apidocs/#/default/get_api___website_stats
-
https://api.ooni.io/apidocs/#/default/get_api___website_urls
Misc functions:
-
ASN 💡 metadata https://api.ooni.io/apidocs/#/default/get_api___asnmeta
-
Check uploaded reports https://api.ooni.io/apidocs/#/default/get_api___check_report_id
For debugging: https://api.ooni.io/apidocs/#/default/get_api___quotas_summary See Rate limiting and quotas 🐝 for details.
note There are other entry points under
/api/_that are not part of this module, e.g. OONI Run 🐝
Rate limiting and quotas
The API is provided with rate limiting functions and traffic quotas to provide fair use and protect the database from overloading. It was initially implemented to protect PostgreSQL used in the past.
The rate limiting is based on multiple usages quotas with monthly,
weekly and daily limits. The limit are applied to /24 subnets where
HTTP connections are coming from by default, or with a token system for
authenticated accounts. Quotas are stored in
LMDB in order to track the values
consistently across API processes with minimal increase in CPU and I/O
load.
Resource usage can vary widely between different API entry points and query parameters. In order to account resource consumption both in terms of CPU and disk I/O quotas are consumed based on the wallclock time taken to to process each API call. This means that i.e. an API call that takes 2 seconds consumes 20 times more quota than a call that takes 100 ms.
When any of the monthly, weekly and daily quotas are exceeded users receive HTTP 429 (Too Many Requests) until quotas are incremented again. Increments happen every hour.
There’s an API call to get a summary of used quotas: https://api.ooni.io/api/_/quotas_summary See Investigating heavy aggregation queries runbook 📒 for usage examples.
Configuration for rate limiting is at: https://github.com/ooni/backend/blob/0ec9fba0eb9c4c440dcb7456f2aab529561104ae/api/ooniapi/app.py
OONI Run
This module implements management of OONI Run links.
All the routes related to this module are mounted under
/api/v1/ooni_run/:
-
List OONIRun descriptors https://api.ooni.io/apidocs/#/default/get_api___ooni_run_list
-
Archive an OONIRun descriptor and all its past versions https://api.ooni.io/apidocs/#/default/post_api*ooni_run_archiveooni_run_link_id*
-
Create a new oonirun link or a new version for an existing one https://api.ooni.io/apidocs/#/default/post_api___ooni_run_create
-
Fetch OONIRun descriptor by creation time or the newest one https://api.ooni.io/apidocs/#/default/get_api*ooni_run_fetchooni_run_link_id*
Specifications are published at: https://github.com/ooni/spec/blob/master/backends/bk-005-ooni-run-v2.md
OONI Run links can be updated by sending new translations and new
versions. Each entry is stored as a new database row. The creation entry
point detects if the new submission contains only translation changes.
In that case it only updates translation_creation_time. Otherwise it
also updates descriptor_creation_time. The two values are then used by
the probe to access either the latest translation for a given
descriptor_creation_time, or the latest version overall.
CitizenLab
The citizenlab.py module contains entry points related to managing
both the CitizenLab Test List 💡 and
Prioritization management 🐝.
This subchapter describes the first part.
The following entry points allow authenticated users to propose changes to the CitizenLab repository. It is a private API used by Test List Editor 🖱. The API manages an internal clone of the CitizenLab repository for each user that goes through the workflow.
Entry points:
-
Fetch Citizenlab URL list and additional metadata https://api.ooni.io/apidocs/#/default/get_api___url_submission_test_list__country_code_
-
Create/update/delete a CitizenLab URL entry. Changes are stored in a temporary git repository in the API https://api.ooni.io/apidocs/#/default/post_api_v1_url_submission_update_url
-
Submit changes by opening a pull request on the CitizenLab repository https://api.ooni.io/apidocs/#/default/post_api_v1_url_submission_submit
The repository goes through the following state machine:
stateDiagram-v2    direction LR    classDef green fill:#eeffee,black,font-weight:bold,stroke-width:2px
    [*] --> CLEAN: checkout    CLEAN:::green --> IN_PROGRESS: make changes    IN_PROGRESS:::green --> PR_OPEN: open PR    PR_OPEN:::green --> IN_PROGRESS: close PR    PR_OPEN --> CLEAN: PR merged/rejected
Description of the states:
-
● - the local repository does not exist yet
-
CLEAN - the local repository has no changes and it is in sync with the CitizenLab public repository
-
IN_PROGRESS - there are some changes in the working tree but they have not been pushed to the public repository’s pull request branch
-
PR_OPEN - a pull request is open
Users can open a pull request and close it to make further changes. The “PR merged/rejected” edge in the state machine diagram the only transition that is not started by the user.
See CitizenLab test list updater ⚙ for a description of the data flow.
See Metrics list 💡 for application metrics.
Prioritization management
This part of the API is used by the OONI team to manage prioritization
rules for URLs used by Web connectivity test Ⓣ. It lives
in the citizenlab.py module.
The UI is at https://test-lists.ooni.org/prioritization and it is part
of the Test List Editor 🖱. It is available to accounts with
admin role only.
See Prioritization 🐝 for the prioritization rules logic.
There are two entry points:
-
List URL priority rules https://api.ooni.io/apidocs/#/default/get_api___url_priorities_list
-
Add/update/delete an URL priority rule https://api.ooni.io/apidocs/#/default/post_api___url_priorities_update
The changes are immediately applied to the url_priorities table and used by Prioritization 🐝.
Public and private web UIs
Explorer
UI to display measurements and aggregated data to the users https://explorer.ooni.org/
Fetches data from the API ⚙
CitizenLab Test List
A list of URLs for Web connectivity test Ⓣ managed by the CitizenLab project.
The repository lives at https://github.com/citizenlab/test-lists
It is fetched automatically by the CitizenLab test list updater ⚙.
Test List Editor
UI to allow authenticated users to submit or edit URLs in the CitizenLab Test List https://test-lists.ooni.org/
Documented at https://ooni.org/support/github-test-lists/
Fetches data from the CitizenLab 🐝 API.
Prioritization rules UI
UI for internal use to manage prioritization rules. It is available at https://test-lists.ooni.org/prioritization and it is part of the Test List Editor 🖱.
See Prioritization management 🐝 for details.
Fastpath
The fastpath is a data processing pipeline designed to process incoming measurements in real time.
It also supports processing old measurements by fetching them from the S3 data bucket 💡.
-
Generate scoring metadata and flag them as
confirmed,anomalyas needed. -
Detect invalid measurements (e.g. from the future) and flag them as
failed. -
Extract metadata from measurements e.g.
engine_version -
Write scoring and metadata to the fastpath table ⛁
-
Extract OpenVPN observations into obs_openvpn table ⛁
Data flow diagram:
flowchart LR
      A(Probes) --> B(API) --> C(Fastpath HTTP)      C --> D(queue) --> E(Fastpath worker)      E --> F(fa:fa-database fastpath)
      style A fill:#ffeeee      style B fill:#eeffee      style C fill:#eeffee      style D fill:#eeffee      style E fill:#eeffee      style F fill:#eeffee
Ellipses represent data; rectangles represent processes. Click on the image and then click on each shape to see related documentation.
The fastpath has been designed around a set of goals:
-
Resiliency: the processing pipeline is lenient towards measurements with missing or incorrect fields to mitigate the impact of known and unknown bugs in the incoming measurements. Also it is designed to minimize the risk of crashing out, blocking or deadlocking. Ancillary data sources e.g. Fingerprint updater ⚙ have failure modes that do not block the fastpath.
-
Horizontal scalability: Measurement processing is stateless and supports lockless multiprocessing. Measurement collection, spooling and processing can scale horizontally on multiple hosts.
-
Security: measurements are received from a public API and treated as untrusted input. All backend components are built on a secure SBOM and are sandboxed using minimum privileges.
-
Maintainability: all data flows in one direction from the API through a simple queue system to the database. The only information flowing in the opposite direction is backpressure to prevent stalling or unbounded RAM usage when the CPUs are saturated. The code style favors simplicity and readability over speed and feature richness.
-
Support unit, functional, end-to-end integration testing, CI/CD.
Core logic
Python module: https://github.com/ooni/backend/blob/0ec9fba0eb9c4c440dcb7456f2aab529561104ae/fastpath/fastpath/core.py
Implement the main logic:
-
Parse CLI options and configuration files and manage local directories.
-
Fetch and prepare HTTP and DNS fingerprints from the fingerprints_dns table ⛁ and fingerprints_http table ⛁. See Fingerprint updater ⚙.
-
Spawn a local HTTP server to receive fresh measurements from the API. See
localhttpfeeder.py -
Spawn and manage a worker pool to scale out horizontally on available CPU cores.
-
Alternatively, feed measurements from the S3 data bucket 💡.
-
Process incoming measurements, see the
process_measurementfunction. -
Score each measurement individually, see the
score_measurementfunction. The scoring functions e.g.score_measurement_telegramare meant to focus only on test-specific data, be stateless and unit-testable in isolation. -
Generate anomaly, confirmed and failure flag consistently with Explorer 🖱 and the batch pipeline used before.
-
Extract metadata and upsert each measurement into fastpath table ⛁ in
clickhouse_upsert_summary
The fastpath also supports buffering writes into large batches to avoid single-record insert queries in ClickHouse. This provides a 25x speedup when Reprocessing measurements 📒 from S3 data bucket 💡.
This is not meant to be used for real-time measurement scoring as it would create risk of losing multiple records in case of failed query, crash, etc and also increase latency.
note Batching writes can also be implemented in ClickHouse using Buffer Table Engine or async insert
Database module
Python module: https://github.com/ooni/backend/blob/0ec9fba0eb9c4c440dcb7456f2aab529561104ae/fastpath/fastpath/db.py
Implements all the database-related functions. The rest of the codebase is database-agnostic.
note Upserts are based on the MergeTree table engine, see Overall design 💡.
S3 Feeder
Python module: https://github.com/ooni/backend/blob/0ec9fba0eb9c4c440dcb7456f2aab529561104ae/fastpath/fastpath/s3feeder.py
Implements the fetching of measurements from S3 data bucket 💡. The rest of the codebase is agnostic of S3.
It supports new and legacy cans and JSON and YAML formats.
See Feed fastpath from JSONL 🐞
YAML normalization
Python module: https://github.com/ooni/backend/blob/0ec9fba0eb9c4c440dcb7456f2aab529561104ae/fastpath/fastpath/normalize.py
Transforms legacy measurement format in YAML into JSON. YAML form is legacy and not used for new measurements.
Test helpers
Test helpers are hosts that provide the test helper oohelperd service
to probes. They are deployed by
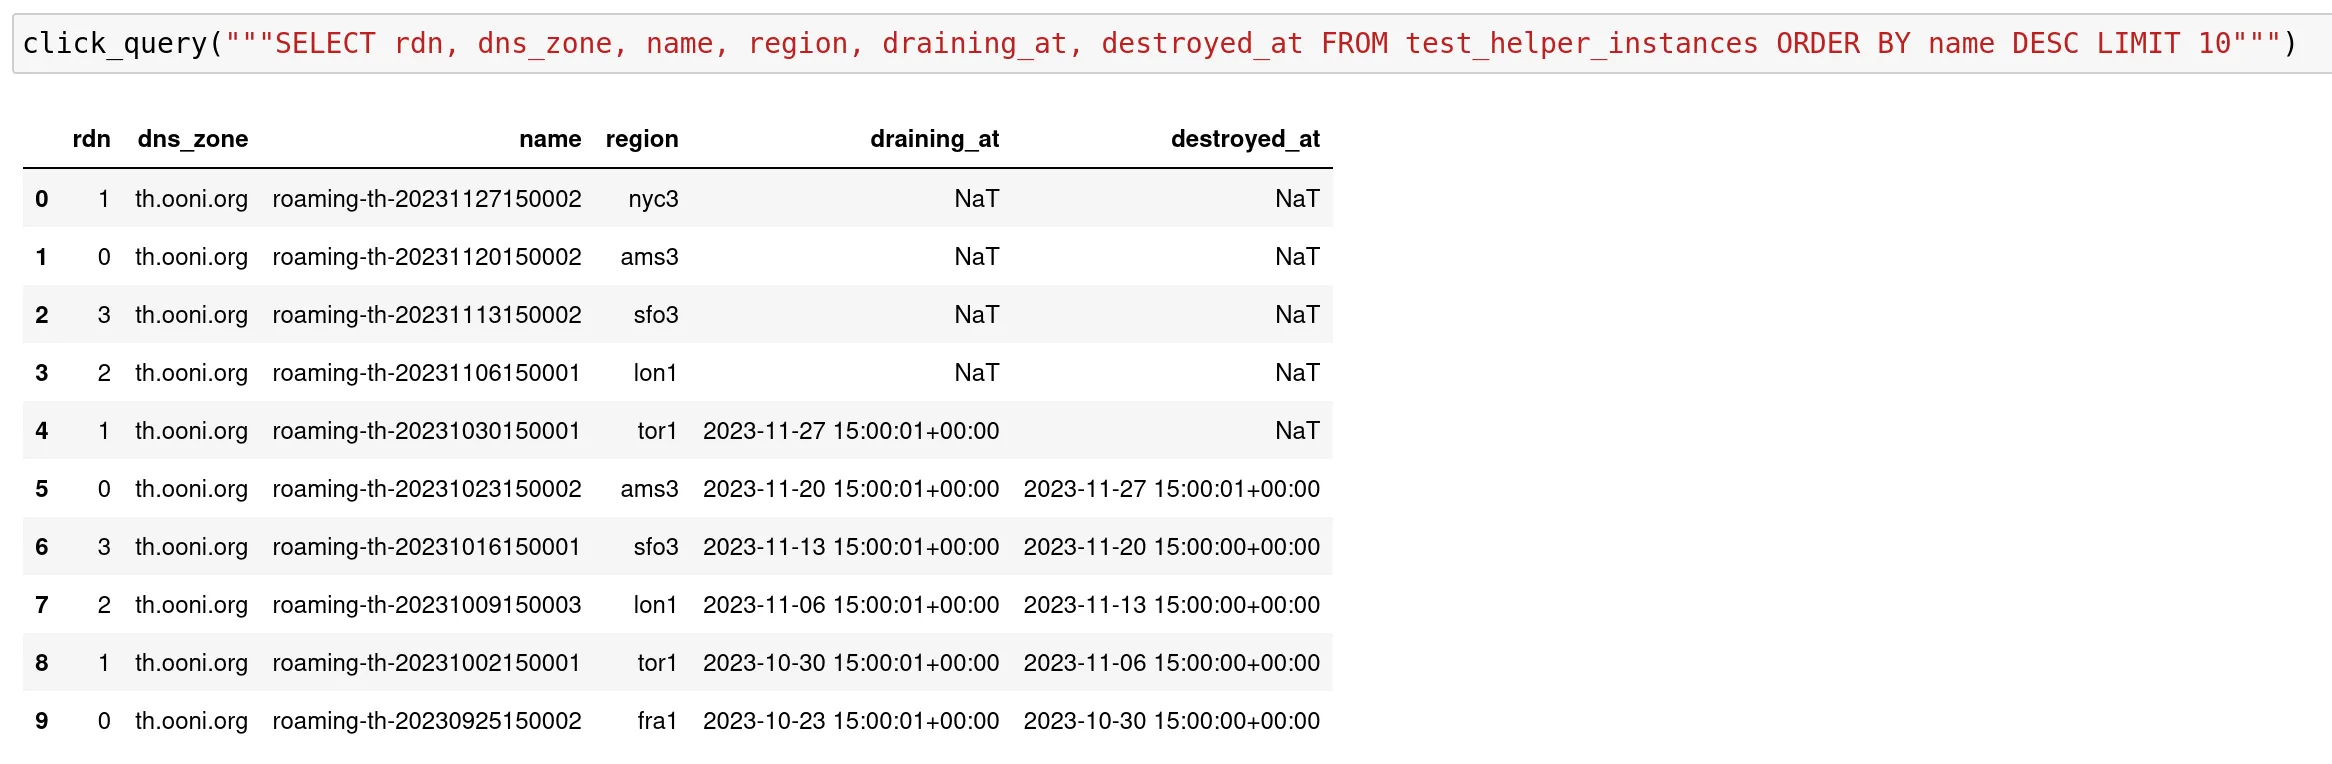
Test helper rotation ⚙ and tracked in
test_helper_instances table ⛁.
They have names and DNS entries <number>.th.ooni.org. See
Test helper rotation ⚙ for details on the deployment
process.
Test helpers send metrics to Prometheus 🔧 and send logs to monitoring.ooni.org 🖥.
See Test helpers dashboard 📊 for metrics and alarming and Test helpers failure runbook 📒 for troubleshooting.
The address of the test helpers are provided to the probes by the API in
Test helpers list 🐝.
0.th.ooni.org is treated differently from other test helpers.
Analysis
Miscellaneous scripts, services and tools. It contains ancillary components that are not updated often and might not justify a dedicated Debian package for each of them.
Deployed using the analysis package 📦
https://github.com/ooni/backend/blob/0ec9fba0eb9c4c440dcb7456f2aab529561104ae/analysis/
Data flows from various updaters:
Ellipses represent data; rectangles represent processes. Purple components belong to the backend. Click on the image and then click on each shape to see related documentation.
See the following subchapters for details:
CitizenLab test list updater
This component fetches the test lists from CitizenLab Test List 💡 and populates the citizenlab table ⛁ and citizenlab_flip table ⛁.
flowchart LR
    A(Github repository) --> B(updater)    B --> C(fa:fa-database citizenlab) --> E(API)    B --> D(fa:fa-database citizenlab_flip)    E --> TLE(Test List Editor)
    style B fill:#ffeeee    style A fill:#eeffee    style C fill:#eeffee    style D fill:#eeffee    style E fill:#eeffee
The git repository https://github.com/citizenlab/test-lists.git is cloned as an unauthenticated user.
Database writes are performed as the citizenlab user.
The tables have few constraints on the database side: most of the
validation is done in the script and it is meant to be strict. The
updater overwrites citizenlab_flip table ⛁ and
then swaps it with citizenlab table ⛁ atomically. In
case of failure during git cloning, verification and table overwrite the
final swap does not happen, leaving the citizenlab table unaltered.
It is deployed using the analysis package 📦 and started by the ooni-update-citizenlab ⏲ Systemd timer.
Logs are generated as the analysis.citizenlab_test_lists_updater unit.
Also it generates the following metrics with the
citizenlab_test_lists_updater prefix:
| Metric name | Type | Description |
|---|---|---|
fetch_citizen_lab_lists | timer | Fetch duration |
update_citizenlab_table | timer | Update duration |
citizenlab_test_list_len | gauge | Table size |
The updater lives in one file: https://github.com/ooni/backend/blob/0ec9fba0eb9c4c440dcb7456f2aab529561104ae/analysis/analysis/citizenlab_test_lists_updater.py
To run the updater manually during development:
PYTHONPATH=analysis ./run_analysis --update-citizenlab --dry-run --stdoutFingerprint updater
This component fetches measurement fingerprints as CSV files from https://github.com/ooni/blocking-fingerprints and populates fingerprints_dns table ⛁, fingerprints_dns_tmp table ⛁, fingerprints_http table ⛁ and fingerprints_http_tmp table ⛁.
The tables without _tmp are used by the Fastpath ⚙.
The CSV files are fetched directly without git-cloning.
Database writes are performed as the api user, configured in
https://github.com/ooni/backend/blob/0ec9fba0eb9c4c440dcb7456f2aab529561104ae/analysis/analysis/analysis.py#L64
The tables have no constraints on the database side and basic validation is performed by the script: https://github.com/ooni/backend/blob/0ec9fba0eb9c4c440dcb7456f2aab529561104ae/analysis/analysis/fingerprints_updater.py#L91
The updater overwrites the tables ending with _tmp and then swaps them
with the “real” tables atomically. In case of failure the final swap
does not happen, leaving the “real” tables unaltered.
It is deployed using the analysis package 📦 and started by the ooni-update-citizenlab ⏲ Systemd timer.
Logs are generated as the analysis.fingerprints_updater unit.
Also it generates the following metrics with the fingerprints_updater
prefix:
| Metric name | Type | Description |
|---|---|---|
fetch_csv | timer | CSV fetch duration |
fingerprints_update_progress | gauge | Update progress |
fingerprints_dns_tmp_len | gauge | DNS table size |
fingerprints_http_tmp_len | gauge | HTTP table size |
See the Fingerprint updater dashboard 📊 on Grafana.
The updater lives primarily in
https://github.com/ooni/backend/blob/0ec9fba0eb9c4c440dcb7456f2aab529561104ae/analysis/analysis/fingerprints_updater.py
and it’s called by the analysis.py script
To run the updater manually during development:
PYTHONPATH=analysis ./run_analysis --update-citizenlab --dry-run --stdoutASN metadata updater
This component fetches ASN metadata from https://archive.org/download/ip2country-as (generated via: https://github.com/ooni/historical-geoip)
It populates the asnmeta table ⛁ and asnmeta_tmp table ⛁.
asnmeta table is used by the private API ⚙, see: https://github.com/ooni/backend/blob/0ec9fba0eb9c4c440dcb7456f2aab529561104ae/api/ooniapi/private.py#L923 and https://api.ooni.io/apidocs/#/default/get_api___asnmeta
Database writes are performed as the api user, configured in
https://github.com/ooni/backend/blob/0ec9fba0eb9c4c440dcb7456f2aab529561104ae/analysis/analysis/analysis.py#L64
The table has no constraints on the database side and basic validation is performed by the script: https://github.com/ooni/backend/blob/0ec9fba0eb9c4c440dcb7456f2aab529561104ae/analysis/analysis/asnmeta_updater.py#L95
Logs are generated as the analysis.asnmeta_updater unit.
Also it generates the following metrics with the asnmeta_updater
prefix:
| Metric name | Type | Description |
|---|---|---|
fetch_data | timer | Data fetch duration |
asnmeta_update_progress | gauge | Update progress |
asnmeta_tmp_len | gauge | table size |
See the ASN metadata updater dashboard 📊 on Grafana.
To run the updater manually during development:
PYTHONPATH=analysis ./run_analysis --update-asnmeta --stdoutGeoIP downloader
Fetches GeoIP databases, installed by the ooni-api ⚙. Started by the ooni-download-geoip timer ⏲ on backend-fsn.ooni.org 🖥, see.
Lives at https://github.com/ooni/backend/blob/0ec9fba0eb9c4c440dcb7456f2aab529561104ae/ https://github.com/ooni/backend/blob/0ec9fba0eb9c4c440dcb7456f2aab529561104ae/api/debian/ooni_download_geoip.py
Updates asn.mmdb and cc.mmdb in /var/lib/ooniapi/
Can be monitored with the GeoIP MMDB database dashboard 📊 and by running:
sudo journalctl --identifier ooni_download_geoipDatabase backup tool
The backup tool is a service that regularly backs up
ClickHouse ⚙ tables to S3. It also exports tables in
CSV.zstd format for public consumption.
Contrarily to similar tools, it is designed to:
-
extract data in chunks and upload it without creating temporary files
-
without requiring transaction support in the database (not available in ClickHouse)
-
without requiring transactional filesystems or interrupting the database workload
It is configured by Ansible 🔧 using the
/etc/ooni/db-backup.conf file. Runs as a SystemD service, see
ooni-db-backup timer ⏲
It compresses data using https://facebook.github.io/zstd/ during the upload.
The tool chunks tables as needed and add sleeps as needed to prevent a query backlog impacting the database performance.
Logs are generated as the ooni-db-backup unit.
Also it generates the following metrics with the db-backup prefix:
| Metric name | Type | Description |
|---|---|---|
upload_to_s3 | timer | Data upload duration |
run_export | timer | Data export duration |
table_{tblname}_backup_time_ms | timer | Table backup time |
See the Database backup dashboard 📊 on Grafana and Metrics list 💡 for application metrics.
Monitor with:
sudo journalctl -f --identifier ooni-db-backupFuture improvements:
-
database schema backup. For extracting the schema see Database schema check 💡
Ancillary modules
analysis/analysis/analysis.py is the main analysis script and acts as
a wrapper to other components.
analysis/analysis/metrics.py is a tiny wrapper for the Statsd Python
library.
Social media blocking event detector
Blocking event detector currently under development. Documented in https://docs.google.com/document/d/1WQ6_ybnPbO_W6Tq-xKuHQslG1dSPr4jUbZ3jQLaMqdw/edit
Deployed by the detector package 📦.
See Monitor blocking event detections notebook 📔 Event detector dashboard Detector timer ⏲
OONI bridges
OONI bridges are a new design for handling the connectivity between Probes and the backend components.
The provide a set of benefits compared to the previous architecture:
-
Circumvention: the entry point for the API accepts all FDQN allowing mitigation for DPI-based blocking.
-
Circumvention 2: bridges are designed to be deployed on both publicly known and “static” IP addresses as well as ephemeral, less visible addresses and/or lesser known hosting providers.
-
Bridges are stateless and could be deployed by Test helper rotation ⚙.
-
Test helper VMs can run HaProxy and be used as bridges without impacting their ability to run test helpers as well.
-
-
Faster connectivity: probes use the same HTTPS connection to a bridge for both traffic to the API and to the test helper.
-
Resiliency: Test helpers are load-balanced using stateful connections. Anything affecting the test helpers is not going to impact the Probes, including: test helper rotation, CPU overload, network weather or datacenter outages.
The current configuration is based on HaProxy ⚙ being run as a load balancer in front of Test helpers ⚙ and the previously configured Nginx ⚙ instance.
The configuration is stored in https://github.com/ooni/sysadmin/blob/master/ansible/roles/ooni-backend/templates/haproxy.cfg
The following diagram shows the load balancing topology:
In the diagram caching for the API and proxying for various services is still done by Nginx for legacy reasons but can be moved to HaProxy to simplify configuration management and troubleshooting.
Bridges are deployed as:
-
ams-pg-test.ooni.org 🖥 https://ams-pg-test.ooni.org:444/__haproxy_stats
-
backend-hel.ooni.org 🖥 https://backend-hel.ooni.org:444/__haproxy_stats
-
bridge-greenhost.ooni.org 🖥 https://bridge-greenhost.ooni.org:444/__haproxy_stats
Test helper rotation
The test helper rotation script is responsible for spawning and deploying VMs on Digital Ocean to be used as Test helpers ⚙.
The main goals for this architecture are:
-
Incremental rollout: the deployment of a new version of the test helper (
oohelperd) is performed incrementally over 4 weeks without requiring manual intervention. This allow detecting changes in:-
Percentages of
anomaly/confirmedandfailuremeasurements -
Test execution time, CPU and memory usage.
-
-
Resiliency: traffic between probes and test helpers could be blocked by 3rd parties. The rotation system mitigates this risk by cycling countries, datacenters and IP addresses across a very large pool. The tool is designed to allow future extensions to support other hosting providers in order to increase the address pool.
-
Trust: test helpers could be treated differently than other hosts by censors e.g. allowing test helpers to reach websites otherwise blocked. By rotating test helpers this risk is also mitigated.
-
Failure resolution: in case of failure of a test helper due to crash, hardware or network issues, DoS etc. the impacted host can be replaced within 5 minutes.
-
Future extension: The ability to rotate country / datacenter / IP address can also be used for OONI bridges ⚙ in future.
The primary functions are:
-
Select datacenters and spawn VMs. This allows having helpers to live in many countries, datacenters and subnets making attempts at blocking them more difficult.
-
Runs a setup script on the host at first boot
-
Keeps a list of live and old hosts in a dedicated database table
-
Create SSL certificates using the Digital Ocean API
-
Performs end-to-end test on newly created VMs to ensure the test helper service is running
-
Update DNS to publish new services
-
Drain and destroy old VMs
A summary of the sequence to deploy, drain and destroy a test helper VM:
sequenceDiagram Rotation->>Digital Ocean: Spawn VM Digital Ocean->>+TH: Spawn Rotation-->>+TH: Poll for readiness TH-->>-Rotation: Ready Rotation->>+Digital Ocean: Create TLS cert Digital Ocean->>-Rotation: TLS cert Rotation->>TH: Install TLS cert Rotation->>TH: Start service Rotation->>TH: Run TH test Rotation->>Digital Ocean: Update DNS: publish Rotation->>Digital Ocean: Update DNS: drain Rotation->>Digital Ocean: Terminate VM Digital Ocean->>TH: Terminate TH->>-Digital Ocean: TerminatesDNS propagation time affects the probe’s ability to move to a newly deployed test helper quickly. This is why the rotation script includes a generous draining period and destroys old VMs after a week.
note When triggering rotations manually monitor the change in traffic and give probes enough time to catch up.
It is designed to be extended:
-
Support multiple cloud services. The database tables already contain columns to track VMs on different cloud providers.
-
Support deploying OONI bridges ⚙. This can provide frequently changing “entry point” IP addresses for probes.
The script is deployed on backend-fsn.ooni.org 🖥 using the analysis deb package 📦
The configuration is deployed using Ansible 🔧:
-
/etc/ooni/rotation.conf: main configuration file deployed using https://github.com/ooni/sysadmin/blob/master/ansible/roles/ooni-backend/tasks/main.yml -
/etc/ooni/rotation_setup.sh: this script is executed on the VMs for configuration, see https://github.com/ooni/sysadmin/blob/master/ansible/roles/ooni-backend/templates/rotation_nginx_conf -
/etc/ooni/rotation_nginx_conf: configuration for Nginx to be deployed on the VMs, see https://github.com/ooni/sysadmin/blob/master/ansible/roles/ooni-backend/templates/rotation_setup.sh
Test helpers are named <number>.th.ooni.org. This is required to
generate *.th.ooni.org certificates.
To troubleshoot rotation see the test helper rotation runbook 📒
Internals
The tool reads /etc/ooni/rotation.conf
It uses the following APIs:
-
Digital Ocean API: DNS A/AAAA records
-
Digital Ocean API: Live droplets
Other stateful data exists only in:
-
test_helper_instances database table
-
“Let’s Encrypt” SSL certificates for
*.th.ooni.orgtemporarily stored on local host and pushed to the test helpers
For the database table setup see test_helper_instances table ⛁.
Example of /etc/ooni/rotation.conf
[DEFAULT]token = CHANGEMEactive_droplets_count = 4size_slug = s-1vcpu-1gbimage_name = debian-10-x64draining_time_minutes = 240dns_zone = th.ooni.orgSimple example for /etc/ooni/rotation_setup.sh:
#!/bin/bash# Configure test-helper droplet# This script is run as root and with CWD=/set -euo pipefailexec 1>setup.log 2>&1echo "deb [trusted=yes] https://ooni-internal-deb.s3.eu-central-1.amazonaws.com unstable main" > /etc/apt/sources.list.d/ooni.listapt-key adv --verbose --keyserver hkp://keyserver.ubuntu.com --recv-keys 'B5A08F01796E7F521861B449372D1FF271F2DD50'apt-get updateapt-get upgrade -qyecho > /etc/motdapt-get install -qy oohelperdapt-get install -qy oohelperd nginx-lightIt is activated by the ooni-rotation timer ⏲ Systemd
timer Generates metrix prefixed as rotation and logs as a journald
unit named rotation.
Related files in the backend repository:
analysis/rotation.pyanalysis/tests/test_rotation.pywarning The script has no access to security-critical credentials for services like Namecheap, however it has the ability to spawn VMs and control Digital Ocean’s DNS.
Measurement uploader
This component uploads fresh measurements from backend-fsn.ooni.org to S3 data bucket 💡 after compressing them into Postcans 💡 and .jsonl files.
It inserts records in the jsonl table ⛁ using the api
database user.
The uploader runs hourly. The measurement batching process is designed to avoid data loss in case of interruption or crash:
-
Scan for raw measurements from the spool directory, typically
/var/lib/ooniapi/measurements/incoming/ -
Generate one Postcans 💡 and JSONL files 💡 in a different directory
-
Delete the raw measurements
-
Upload the postcan and jsonl files to S3 data bucket 💡
-
Insert new records in jsonl table ⛁ with fields
report_id,input,s3path,linenum,measurement_uid
The jsonl table is used by the API to look up measurement bodies. There
is one line per measurement. The s3path column identifies the key on
S3 data bucket 💡 containing the compressed JSONL file
with the measurement data. The linenum column contains the line number
in such file where the measurement is found. See
Measurements 🐝
Reads the /etc/ooni/api.conf file. The file itself is deployed by
Ansible 🔧.
Also see the Measurement uploader dashboard 📊, uploader timer and Main data flows 💡
Postcans
A “postcan” is tarball containing measurements as they are uploaded by the probes, optionally compressed. Postcans are meant for internal use.
S3 data bucket
The ooni-data-eu-fra Amazon S3 bucket contains the whole OONI dataset.
It is accessible with the S3 protocol and also over HTTPS:
https://ooni-data-eu-fra.s3.eu-central-1.amazonaws.com/
It uses a dedicated Open Data account providing free hosting for public data. Details on the OONI account used for this are in the Team credential repository 💡.
note All data on the bucket has to be kept publicly accessible to comply with the Open Data requirements. Do not run other AWS services using the Open Data account.
S3 measurement files layout
Probes usually upload multiple measurements on each execution. Measurements are stored temporarily and then batched together, compressed and uploaded to the S3 bucket once every hour. To ensure transparency, incoming measurements go through basic content validation and the API returns success or error; once a measurement is accepted it will be published on S3.
Specifications of the raw measurement data can be found inside of the
ooni/spec repository.
JSONL files
File paths in the S3 bucket in JSONL format.
Contains a JSON document for each measurement, separated by newline and compressed, for faster processing. The JSONL format is natively supported by various data science tools and libraries.
The path structure allows to easily select, identify and download data based on the researcher’s needs.
In the path template:
-
ccis an uppercase 2 letter country code -
testnameis a test name where underscores are removed -
timestampis a YYYYMMDD timestamp -
nameis a unique filename
Compressed JSONL from measurements before 20201021
The path structure is:
s3://ooni-data-eu-fra/jsonl/<testname>/<cc>/<timestamp>/00/<name>.jsonl.gz
Example:
s3://ooni-data-eu-fra/jsonl/webconnectivity/IT/20200921/00/20200921_IT_webconnectivity.l.0.jsonl.gzYou can list JSONL files with:
s3cmd ls s3://ooni-data-eu-fra/jsonl/s3cmd ls s3://ooni-data-eu-fra/jsonl/webconnectivity/US/20201021/00/Compressed JSONL from measurements starting from 20201020
The path structure is:
s3://ooni-data-eu-fra/raw/<timestamp>/<hour>/<cc>/<testname>/<ts2>_<cc>_<testname>.<host_id>.<counter>.jsonl.gzExample:
s3://ooni-data-eu-fra/raw/20210817/15/US/webconnectivity/2021081715_US_webconnectivity.n0.0.jsonl.gzNote: The path will be updated in the future to live under /jsonl/
You can list JSONL files with:
s3cmd ls s3://ooni-data-eu-fra/raw/20210817/15/US/webconnectivity/Raw “postcans” from measurements starting from 20201020
Each HTTP POST is stored in the tarball as
<timestamp>_<cc>_<testname>/<timestamp>_<cc>_<testname>_<hash>.post
Example:
s3://ooni-data-eu-fra/raw/20210817/11/GB/webconnectivity/2021081711_GB_webconnectivity.n0.0.tar.gzListing postcan files:
s3cmd ls s3://ooni-data-eu-fra/raw/20210817/s3cmd ls s3://ooni-data-eu-fra/raw/20210817/11/GB/webconnectivity/Other backend components
Nginx
Nginx https://www.nginx.com/ is used across various servers in the backend, primarily as a reverse proxy. It’s worth summarizing the main different uses here:
-
Reverse proxy for the API ⚙, also providing caching from many API methods
-
Serving local measurements from disk from the backend hosts
-
Serving Atom/RSS feeds from disk from the backend hosts
-
Serving ACME challenge text files for Dehydrated ⚙
-
Reverse proxy for the test helpers
-
Reverse proxy for deb.ooni.org
-
Reverse proxy for internal or ancillary services e.g. Prometheus scraping, Grafana 🔧 etc
Nginx configuration files are stored in https://github.com/ooni/sysadmin/tree/master/ansible
Most of the proxying functionalities of Nginx can be replaced with HaProxy ⚙ to benefit from load balancing and active checks.
Caching could be provided by Varnish https://varnish-cache.org/ as it provides the ability to explicitly purge caches. This would be useful when testing the API.
Purging Nginx cache
While testing the API it can be useful to purge the cache provide by Nginx.
This selectively removes the cache files used for the API:
rm /var/cache/nginx/ooni-api/* -rfnote This method is not natively supported by Nginx. It’s recommended to use it only on the backend testbed.
HaProxy
HaProxy runs on the OONI bridges ⚙ and works as a load balancer for the test helpers and the APIs on backend-hel.ooni.org, ams-pg-test.ooni.org 🖥 and the bridge on bridge-greenhost.ooni.org 🖥.
Contrasted to Nginx ⚙ it’s focused on load balancing rather than serving files and provides:
-
dashboards showing the current status of the web services and the load balancing targets
-
flexible active healthchecks and failover
-
more detailed metrics
-
more flexible routing policies that allow implementing better incremental rollouts, A/B testing etc
HaProxy is currently deployed on:
-
ams-pg-test.ooni.org 🖥 https://ams-pg-test.ooni.org:444/__haproxy_stats
-
backend-hel.ooni.org 🖥 https://backend-hel.ooni.org:444/__haproxy_stats
-
bridge-greenhost.ooni.org 🖥 https://bridge-greenhost.ooni.org:444/__haproxy_stats
An example of the built-in dashboard:
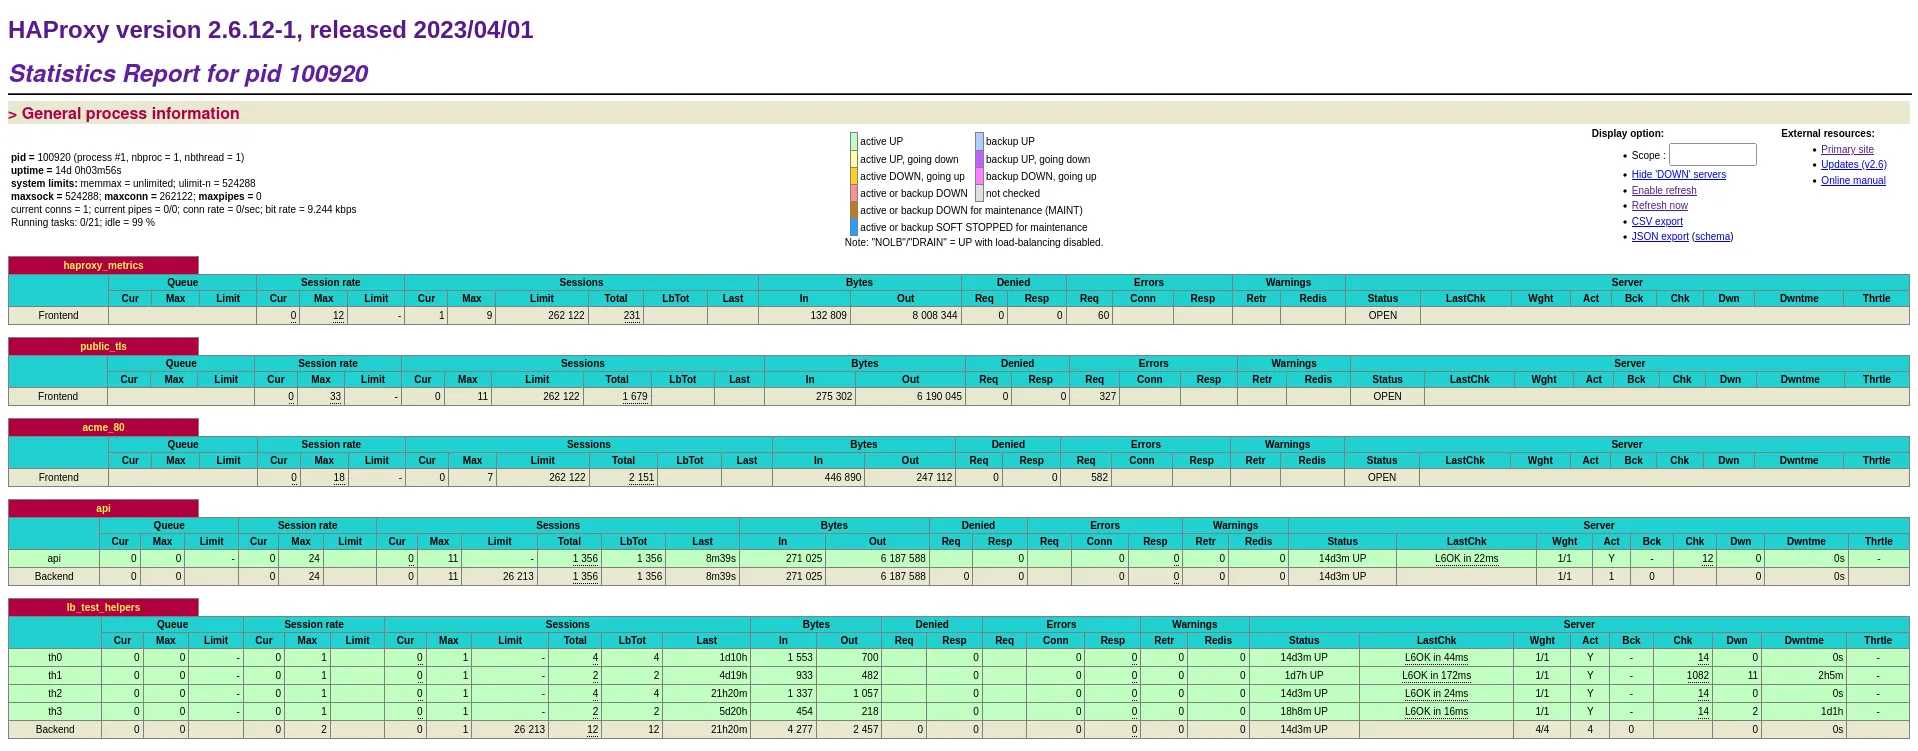
Also see HaProxy dashboard 📊.
When providing load balancing for the Test helpers ⚙ it uses a stateful algorithm based on the source IP address to ensure that every given probe reaches the same test helper. This is meant to help troubleshooting. Yet, in case a test helper becomes unreachable probe traffic is sent to the remaining test helpers. This affects exclusively the probes that were using the unreachable test helper. The probes that were reaching other test helpers are not shuffled around.
Dehydrated
Dehydrated provides Let’s Encrypt certificate handling using ACME. It replaces certbot with a simpler and more reliable implementation.
Dehydrated is configured in Ansible 🔧, see https://github.com/ooni/sysadmin/tree/master/ansible/roles/dehydrated
For monitoring see TLS certificate dashboard 📊. There are alerts configured in Grafana 🔧 to alert on expiring certificates, see Alerting 💡.
Jupyter Notebook
There is an instance of Jupyter Notebook https://jupyter.org/ deployed on the monitoring.ooni.org 🖥 available for internal use at https://jupyter.ooni.org/tree/notebooks
It is used primarily for:
-
Performing research and data analysis using data science tools like Pandas and Altair.
-
Generating automatic dashboards using Jupycron 🔧 and sending alerts.
-
Analyzing logs from the ClickHouse instance for logs ⚙
important There in no user account support in Jupyter Notebook. The instance is protected by HTTP basic auth using team credentials. To clarify ownership of notebooks put your account name as part of the notebook name. To prevent data loss do not modify notebooks owned by other users.
Ooniutils microlibrary
The following notebook is often used as a library in other notebooks: https://jupyter.ooni.org/notebooks/notebooks/ooniutils.ipynb
It can be imported in other notebooks by adding this at the top:
%run ooniutils.ipynbimportant be careful when making changes to it because it could break many notebooks including the ones automatically run by Jupycron 🔧
Running the notebook imports commonly used libraries, including Pandas and Altair, configures Jupyter Notebook and provides some convenience functions:
-
click_query_fsn(query, **params)to run queries against ClickHouse on backend-fsn.ooni.org 🖥. Returns a Pandas dataframe. -
alertmanager_fire_alert(summary, alertname, job="", instance="", annotations={}, duration_min=1)to send an alert through alertmanager (Grafana 🔧). -
send_slack_msg(title, msg, color="3AA3E3")to send messages directly to Slack 🔧. -
send_alert_through_ntfy(title, msg, priority="urgent", tags="warning")to send alerts directly using https://ntfy.sh/ - see Redundant notifications 🔧 for details.
Confusingly, alertmanager_fire_alert needs an alarm duration to be set
when called.
note >
send_slack_msgcan be used in addition to provide more details and subsequent updates to an existing alert.
Additionally, send_slack_msg can deliver clickable links.
note When creating new alerts it is helpful to include full links to the automated notebook generating the alert and its HTML output.
See Jupycron 🔧 for details.
Jupycron
Jupycron is a Python script that runs Jupyter notebooks automatically.
Various notebooks are used to perform analysing, reporting and alarming using data science tools that are more powerful than Grafana and Prometheus 🔧 internal query language. An example is the use of scikit-learn’s machine learning for predicting incoming measurement flow.
It is internally developed and hosted on github. It is deployed by Ansible on monitoring.ooni.org 🖥.
It runs every minute and scans the existing notebooks at
/var/lib/jupyter/notebooks/. It parses only notebooks that have the
word autorun in the filename. (see example below) It then scans the
content of the notebook looking for a code cell that contains a
commented line like:
# jupycron: {"every": "30 minute"}If such line is found it executes the notebook according to the required
time interval and stores the output as an HTML file at
/var/lib/jupyter/notebooks/jupycron
Execution intervals can be specified using keywords:
"min", "hour", "day", "week", "month"note The
AUTORUNenvironment variable is set when a notebook is run under jupycron. Also Ooniutils microlibrary 💡 sets theautorunPython variable toTrue. This can be useful to send alerts only when notebooks are being run automatically.
Jupycron also provides an HTML summary of the existing automated notebooks.
The status column indicates the outcome of the previous run, if any:
-
🟢: successful run
-
🔴: failed run
-
⌛: never executed before
-
🛇: disabled notebook: the
# jupycron: {…}line was not found
note notebooks are executed by
jupyter-nbconvertundersystemd-runwith memory limits to protect the monitoring.ooni.org 🖥 host. The limit can be changed by setting aMaxMemkey in the configuration line, in megabytes.
Debugging tip: Jupycron stores the history of notebook executions in
/var/lib/jupyter/notebooks/jupycron/.history.json.
For an example of automated notebook that sends alarm see Test helper failure rate notebook 📔
note When a notebook is run automatically by Jupycron only the HTML output is updated. The notebook itself is not.
Test helper failure rate notebook
This automated notebook performs a correlation of test failures and the location of Test helpers ⚙.
It sends alerts directly to Slack 🔧.
Notebook: https://jupyter.ooni.org/notebooks/notebooks/autorun_test_helper_failure_rate_alarm.ipynb
Output: https://jupyter.ooni.org/view/notebooks/jupycron/autorun_test_helper_failure_rate_alarm.html
Also see the test helpers notebook 📔, the test helper rotation runbook 📒 and the test helpers failure runbook 📒
Test helpers notebook
This notebook provides tables and charts to investigate the general status of the Test helpers ⚙
It provides a summary of the live and rotated test helpers:
See https://jupyter.ooni.org/notebooks/notebooks/test%20helpers.ipynb for investigation
Also see the test helper rotation runbook 📒 and the test helpers failure runbook 📒
Android probe release notebook
This automated notebook is used to compare changes in incoming measurements across different versions of the Android probe.
It is used in the Android probe release runbook 📒
Notebook: https://jupyter.ooni.org/notebooks/notebooks/autorun_android_probe_release.ipynb
Output: https://jupyter.ooni.org/view/notebooks/jupycron/autorun_android_probe_release.html
iOS probe release notebook
This automated notebook is used to compare changes in incoming measurements across different versions of the iOS probe.
Notebook: https://jupyter.ooni.org/notebooks/notebooks/autorun_ios_probe_release.ipynb
Output: https://jupyter.ooni.org/view/notebooks/jupycron/autorun_ios_probe_release.html
CLI probe release notebook
This automated notebook performs Used to compare changes in incoming measurements across different versions of the CLI probe.
It is used in the CLI probe release runbook 📒
Notebook: https://jupyter.ooni.org/notebooks/notebooks/autorun_cli_probe_release.ipynb
Output: https://jupyter.ooni.org/view/notebooks/jupycron/autorun_cli_probe_release.html
Duplicate test-list URLs notebook
This automated notebook shows duplicate URLs across global and per-country test lists
Notebook: https://jupyter.ooni.org/notebooks/notebooks/autorun_duplicate_test_list_urls.ipynb
Output: https://jupyter.ooni.org/view/notebooks/jupycron/autorun_duplicate_test_list_urls.html
Monitor blocking event detections notebook
This automated notebook monitor the Social media blocking event detector ⚙ creating a summary table with clickable links to events. It also sends notification messages on Slack 🔧.
Notebook: https://jupyter.ooni.org/notebooks/notebooks/autorun_event_detector_alerts.ipynb
Output: https://jupyter.ooni.org/view/notebooks/jupycron/autorun_event_detector_alerts.html
Logs from FSN notebook
This automated notebook provides summaries and examples of log analysis. See ClickHouse instance for logs ⚙ for an overview.
Notebook: https://jupyter.ooni.org/notebooks/notebooks/autorun_fsn_logs.ipynb
Output: https://jupyter.ooni.org/view/notebooks/jupycron/autorun_fsn_logs.html
Logs investigation notebook
This notebook provides various examples of log analysis. See ClickHouse instance for logs ⚙ for an overview.
https://jupyter.ooni.org/notebooks/notebooks/centralized_logs.ipynb
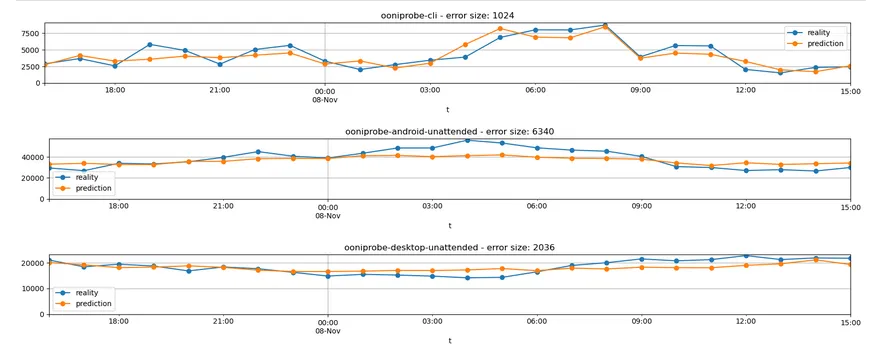
Incoming measurements prediction and alarming notebook
This automated notebook uses Sklearn to implement predictions of the incoming measurement flow using a linear regression. It generates alarms if incoming traffic drops below a given threshold compared to the predicted value.
The purpose of the notebook is to detect major outages or any event affecting ooni’s infrastructure that causes significant loss in incoming traffic.
Predictions and runs work on a hourly basis and process different probe types independently.
Notebook: https://jupyter.ooni.org/notebooks/notebooks/autorun_incoming_measurements_prediction_alarming.ipynb
An example of measurement flow prediction:
Incoming measurements prediction-by-country notebook
This automated notebook is similar to the previous one but evaluates each country independently.
The main purpose is to detect countries encountering significant Internet access disruption or blocking of ooni’s network traffic.
The notebook is currently work-in-progress and therefore monitoring few countries.
Long term measurements prediction notebook
This automated notebook runs long-term predictions of incoming measurement flows and alarms on significant drops.
The purpose is to detect slow decreases in measurements over time that have gone unnoticed in the past in similar situations.
Incoming measurements notebook
This automated notebook provides a dashboard of incoming measurement flows grouped by probe type, from a multiple-year point of view.
Its purpose is to provide charts to be reviewed by the team to discuss long term trends.
Notebook: https://jupyter.ooni.org/notebooks/notebooks/autorun_incoming_msmts.ipynb
Output: https://jupyter.ooni.org/view/notebooks/jupycron/autorun_incoming_msmts.html
ClickHouse queries notebook
This is a non-automated notebook used to summarize heavy queries in ClickHouse ⚙
https://jupyter.ooni.org/notebooks/notebooks/2023%20%5Bfederico%5D%20clickhouse%20query%20log.ipynb
note The
system.query_logtable grows continuously and might be trimmed or emptied usingTRUNCATEto free disk space.
Priorities and weights notebook
Notebooks to investigate prioritization. See Priorities and weights 💡
Campaign investigation notebook
A test campaign has been monitored with the following notebook. It could be tweaked and improved for other campaigns. To reuse it copy it to a new notebook and update the queries. Rerun all cells. The notebook will show how the measurement quantity and coverage increased.
https://jupyter.ooni.org/notebooks/notebooks/2023-05-18%20TL%20campaign.ipynb
Easy charting notebook
This notebook contains examples that can be used as building blocks for various investigations and dashboards.
It provides the easy_msm_count_chart helper function.
Such functions shows measurement counts over time, grouped over a dimension.
By default it shows maximum 6 different values (color bands). This means you are not seeing the total amount of measurements in the charts.
You can add the following parameters, all optional:
title: free-form titlesince: when to start, defaults to “3 months”. You can use day, week, month, yearuntil: when to stop, defaults to now. You can use day, week, month, yeargranularity: how big is each time slice: day, week, month. Defaults to daydimension: what dimension to show as different color bands. Defaults tosoftware_versiondimension_limit: how many values to show as different color bands. Defaults to 6.
The following parameters add filtering. The names should be self explanatory. The default value is no filter (count everything).
filter_software_name: looks only at measurement for a given software name, e.g. “ooniprobe-android”.filter_domainfilter_engine_namefilter_inputfilter_probe_asnfilter_probe_ccfilter_test_name
https://jupyter.ooni.org/notebooks/notebooks/easy_charts.ipynb
Grafana
Grafana https://grafana.com/ is a popular platform for monitoring and alarming.
It is deployed on monitoring.ooni.org 🖥 by Ansible 🔧 and lives at https://grafana.ooni.org/
See Grafana backup runbook 📒 and Grafana editing 📒
ClickHouse instance for logs
There is an instance of ClickHouse deployed on monitoring.ooni.org 🖥 that receives logs. See Log management 💡 for details on logging in general.
See Logs from FSN notebook 📔 and
Logs investigation notebook 📔 for examples on how to query the logs table to
extract logs and generate charts.
note The
logstable on monitoring.ooni.org 🖥 is indexed by__REALTIME_TIMESTAMP. It can be used for fast ordering and filtering by time.
An example of a simple query to show recent logs:
SELECT timestamp, _SYSTEMD_UNIT, messageFROM logsWHERE host = 'backend-fsn'AND __REALTIME_TIMESTAMP > toUnixTimestamp(NOW('UTC') - INTERVAL 1 minute) * 1000000)ORDER BY __REALTIME_TIMESTAMP DESCLIMIT 10Vector
Vector https://vector.dev is a log (and metric) management tool. See Log management 💡 for details.
important Vector is not packaged in Debian yet. See https://bugs.debian.org/cgi-bin/bugreport.cgi?bug=1019316 Vector is currently installed using a 3rd party APT archive.
ClickHouse
ClickHouse is main database that stores measurements and many other tables. It accessed primarily by the API ⚙ and the Fastpath ⚙.
It is an OLAP, columnar database. For documentation see https://clickhouse.com/docs/en/intro
The database schema required by the API is stored in: https://github.com/ooni/backend/blob/0ec9fba0eb9c4c440dcb7456f2aab529561104ae/api/tests/integ/clickhouse_1_schema.sql
ClickHouse is deployed by Ansible 🔧 as part of the deploy-backend.yml playbook. It is installed using an APT archive from the developers and
Related: Database backup tool ⚙
Overall design
The backend uses both the native ClickHouse table engine MergeTree and “foreign” database engines, for example in EmbeddedRocksDB tables.
The MergeTree family is column-oriented, eventually consistent, non-transactional and optimized for OLAP workloads. It is suitable for very large number of records and columns.
The existing tables using MergeTree are meant to support replication in future by switching to ReplicatedMergeTree. This is crucial to implement active/standby and even active/active setups both for increased reliability and performance.
This choice is reflected in how record insertion and deduplication are performed: where possible, the API codebase assumes that multiple API instances can insert and fetch records without leading to inconsistent results. This requires special care in the implementation because MergeTree tables do not support immediate consistency nor transactions.
EmbeddedRocksDB uses https://rocksdb.org/ - a key-value, row-oriented, low-latency engine. Some backend workloads are more suitable for this engine. EmbeddedRocksDB does not support replication.
important Some workloads would better suited for a transactional and immediately consistent database. E.g. OONI Run 🐝 and Incident management 🐝. See https://clickhouse.com/docs/en/engines/table-engines/special/keeper-map
To get an overview of the existing tables and engines use:
SELECT engine, name FROM system.tables WHERE database = 'default' ORDER BY engine, nameAn overview of the more important tables:
-
accounts table ⛁ EmbeddedRocksDB
-
asnmeta table ⛁ MergeTree
-
citizenlab table ⛁ ReplacingMergeTree
-
citizenlab_flip table ⛁ ReplacingMergeTree
-
counters_asn_test_list table ⛁ MaterializedView
-
counters_test_list table ⛁ MaterializedView
-
fastpath table ⛁ ReplacingMergeTree
-
fingerprints_dns table ⛁ EmbeddedRocksDB
-
fingerprints_dns_tmp table ⛁ EmbeddedRocksDB
-
fingerprints_http table ⛁ EmbeddedRocksDB
-
fingerprints_http_tmp table ⛁ EmbeddedRocksDB
-
incidents table ⛁ ReplacingMergeTree
-
jsonl table ⛁ MergeTree
-
msmt_feedback table ⛁ ReplacingMergeTree
-
oonirun table ⛁ ReplacingMergeTree
-
session_expunge table ⛁ EmbeddedRocksDB
-
test_groups table ⛁ Join
-
url_priorities table ⛁ CollapsingMergeTree
note As ClickHouse does not support transactions, there are some workarounds to implement atomic updates of whole tables.
One way is to use two tables with the same schema, where one table receive updates and another one is used for reading, and swap them once the writes are completed. This is used by the API ⚙, Test helper rotation ⚙ and other components. The SQL syntax is:
EXCHANGE TABLES <a> AND <b>accounts table
Used for authentication. Assignes roles to accounts (by account id). The default value for accounts not present in the table is “user”. As such, the table is currently tracking only admin roles.
Schema:
CREATE TABLE default.accounts( `account_id` FixedString(32), `role` String, `update_time` DateTime DEFAULT now())ENGINE = EmbeddedRocksDBPRIMARY KEY account_idTo create and update account roles see:
asnmeta table
Contains ASN 💡 lookup data used by the API
Schema:
CREATE TABLE default.asnmeta( `asn` UInt32, `org_name` String, `cc` String, `changed` Date, `aut_name` String, `source` String)ENGINE = MergeTreeORDER BY (asn, changed)SETTINGS index_granularity = 8192asnmeta_tmp table
Temporary table, see asnmeta table ⛁
Schema:
CREATE TABLE default.blocking_events( `test_name` String, `input` String, `probe_cc` String, `probe_asn` Int32, `status` String, `time` DateTime64(3), `detection_time` DateTime64(0) MATERIALIZED now64())ENGINE = ReplacingMergeTreeORDER BY (test_name, input, probe_cc, probe_asn, time)SETTINGS index_granularity = 4Schema:
CREATE TABLE default.blocking_status( `test_name` String, `input` String, `probe_cc` String, `probe_asn` Int32, `confirmed_perc` Float32, `pure_anomaly_perc` Float32, `accessible_perc` Float32, `cnt` Float32, `status` String, `old_status` String, `change` Float32, `stability` Float32, `update_time` DateTime64(0) MATERIALIZED now64())ENGINE = ReplacingMergeTreeORDER BY (test_name, input, probe_cc, probe_asn)SETTINGS index_granularity = 4citizenlab table
Contains data from the CitizenLab URL testing list repository.
Schema:
CREATE TABLE default.citizenlab( `domain` String, `url` String, `cc` FixedString(32), `category_code` String)ENGINE = ReplacingMergeTreeORDER BY (domain, url, cc, category_code)SETTINGS index_granularity = 4Receive writes from CitizenLab test list updater ⚙
Used by CitizenLab 🐝
citizenlab_flip table
Temporary table. See CitizenLab test list updater ⚙
counters_asn_test_list table
A MATERIALIZED VIEW table that, despite the name, is updated
continuously by ClickHouse as new measurements are inserted in the
fastpath table.
It contains statistics on the incoming measurement flow, grouped by
week, probe_cc, probe_asn and input. It is used by
Prioritization 🐝.
Schema:
CREATE MATERIALIZED VIEW default.counters_asn_test_list( `week` DateTime, `probe_cc` String, `probe_asn` UInt64, `input` String, `msmt_cnt` UInt64)ENGINE = SummingMergeTreeORDER BY (probe_cc, probe_asn, input)SETTINGS index_granularity = 8192 ASSELECT toStartOfWeek(measurement_start_time) AS week, probe_cc, probe_asn, input, count() AS msmt_cntFROM default.fastpathINNER JOIN default.citizenlab ON fastpath.input = citizenlab.urlWHERE (measurement_start_time < now()) AND (measurement_start_time > (now() - toIntervalDay(8))) AND (test_name = \'web_connectivity\')GROUP BY week, probe_cc, probe_asn, inputcounters_test_list table
Similar to counters_asn_test_list table ⛁ -
the main differences are that this table has daily granularity and does
not discriminate by probe_asn
Schema:
CREATE MATERIALIZED VIEW default.counters_test_list( `day` DateTime, `probe_cc` String, `input` String, `msmt_cnt` UInt64)ENGINE = SummingMergeTreePARTITION BY dayORDER BY (probe_cc, input)SETTINGS index_granularity = 8192 ASSELECT toDate(measurement_start_time) AS day, probe_cc, input, count() AS msmt_cntFROM default.fastpathINNER JOIN default.citizenlab ON fastpath.input = citizenlab.urlWHERE (measurement_start_time < now()) AND (measurement_start_time > (now() - toIntervalDay(8))) AND (test_name = \'web_connectivity\')GROUP BY day, probe_cc, inputfastpath table
This table stores the output of the Fastpath ⚙. It is usually the largest table in the database and receives the largest amount of read and write traffic.
It is used by multiple entry points in the API ⚙, primarily for measurement listing and presentation and by the Aggregation and MAT 🐝
Schema:
CREATE TABLE default.fastpath( `measurement_uid` String, `report_id` String, `input` String, `probe_cc` LowCardinality(String), `probe_asn` Int32, `test_name` LowCardinality(String), `test_start_time` DateTime, `measurement_start_time` DateTime, `filename` String, `scores` String, `platform` String, `anomaly` String, `confirmed` String, `msm_failure` String, `domain` String, `software_name` String, `software_version` String, `control_failure` String, `blocking_general` Float32, `is_ssl_expected` Int8, `page_len` Int32, `page_len_ratio` Float32, `server_cc` String, `server_asn` Int8, `server_as_name` String, `update_time` DateTime64(3) MATERIALIZED now64(), `test_version` String, `architecture` String, `engine_name` LowCardinality(String), `engine_version` String, `test_runtime` Float32, `blocking_type` String, `test_helper_address` LowCardinality(String), `test_helper_type` LowCardinality(String), INDEX fastpath_rid_idx report_id TYPE minmax GRANULARITY 1, INDEX measurement_uid_idx measurement_uid TYPE minmax GRANULARITY 8)ENGINE = ReplacingMergeTree(update_time)ORDER BY (measurement_start_time, report_id, input, measurement_uid)SETTINGS index_granularity = 8192See Fastpath deduplication 📒 for deduplicating the table records.
fingerprints_dns table
Stores measurement DNS fingerprints. The contents are used by the
Fastpath ⚙ to detect confirmed measurements.
It is updated by the Fingerprint updater ⚙
Schema:
CREATE TABLE default.fingerprints_dns( `name` String, `scope` Enum8(\'nat\' = 1, \'isp\' = 2, \'prod\' = 3, \'inst\' = 4, \'vbw\' = 5, \'fp\' = 6), `other_names` String, `location_found` String, `pattern_type` Enum8(\'full\' = 1, \'prefix\' = 2, \'contains\' = 3, \'regexp\' = 4), `pattern` String, `confidence_no_fp` UInt8, `expected_countries` String, `source` String, `exp_url` String, `notes` String)ENGINE = EmbeddedRocksDBPRIMARY KEY namefingerprints_dns_tmp table
Temporary table. See Fingerprint updater ⚙
fingerprints_http table
Stores measurement HTTP fingerprints. The contents are used by the
Fastpath ⚙ to detect confirmed measurements.
It is updated by the Fingerprint updater ⚙
Schema:
CREATE TABLE default.fingerprints_http( `name` String, `scope` Enum8(\'nat\' = 1, \'isp\' = 2, \'prod\' = 3, \'inst\' = 4, \'vbw\' = 5, \'fp\' = 6, \'injb\' = 7, \'prov\' = 8), `other_names` String, `location_found` String, `pattern_type` Enum8(\'full\' = 1, \'prefix\' = 2, \'contains\' = 3, \'regexp\' = 4), `pattern` String, `confidence_no_fp` UInt8, `expected_countries` String, `source` String, `exp_url` String, `notes` String)ENGINE = EmbeddedRocksDBPRIMARY KEY namefingerprints_http_tmp table
Temporary table. See Fingerprint updater ⚙
incidents table
Stores incidents. See Incident management 🐝.
Schema:
CREATE TABLE default.incidents( `update_time` DateTime DEFAULT now(), `start_time` DateTime DEFAULT now(), `end_time` Nullable(DateTime), `creator_account_id` FixedString(32), `reported_by` String, `id` String, `title` String, `text` String, `event_type` LowCardinality(String), `published` UInt8, `deleted` UInt8 DEFAULT 0, `CCs` Array(FixedString(2)), `ASNs` Array(UInt32), `domains` Array(String), `tags` Array(String), `links` Array(String), `test_names` Array(String), `short_description` String, `email_address` String, `create_time` DateTime DEFAULT now())ENGINE = ReplacingMergeTree(update_time)ORDER BY idSETTINGS index_granularity = 1jsonl table
This table provides a method to look up measurements in JSONL files stored in S3 data bucket 💡 buckets.
It is written by the Measurement uploader ⚙ when Postcans and JSONL files 💡 just after measurements are uploaded to the bucket.
It is used by multiple entry points in the API ⚙, primarily
by get_measurement_meta.
Schema:
CREATE TABLE default.jsonl( `report_id` String, `input` String, `s3path` String, `linenum` Int32, `measurement_uid` String, `date` Date, `source` String, `update_time` DateTime64(3) MATERIALIZED now64())ENGINE = ReplacingMergeTree(update_time)ORDER BY (report_id, input, measurement_uid)SETTINGS index_granularity = 8192msmt_feedback table
Used for Measurement feedback 🐝
Schema:
CREATE TABLE default.msmt_feedback( `measurement_uid` String, `account_id` String, `status` String, `update_time` DateTime64(3) MATERIALIZED now64(), `comment` String)ENGINE = ReplacingMergeTreeORDER BY (measurement_uid, account_id)SETTINGS index_granularity = 4oonirun table
Used for OONI Run 🐝
Schema:
CREATE TABLE default.oonirun( `ooni_run_link_id` UInt64, `descriptor_creation_time` DateTime64(3), `translation_creation_time` DateTime64(3), `creator_account_id` FixedString(32), `archived` UInt8 DEFAULT 0, `descriptor` String, `author` String, `name` String, `short_description` String, `icon` String)ENGINE = ReplacingMergeTree(translation_creation_time)ORDER BY (ooni_run_link_id, descriptor_creation_time)SETTINGS index_granularity = 1session_expunge table
Used for authentication. It stores
Schema:
CREATE TABLE default.session_expunge( `account_id` FixedString(32), `threshold` DateTime DEFAULT now())ENGINE = EmbeddedRocksDBPRIMARY KEY account_idobs_openvpn table
Table used by OpenVPN tests. Written by the Fastpath ⚙ and read by the API ⚙
Schema:
CREATE TABLE default.obs_openvpn( `anomaly` Int8, `bootstrap_time` Float32, `confirmed` Int8, `error` String, `failure` String, `input` String, `last_handshake_transaction_id` Int32, `measurement_start_time` DateTime, `measurement_uid` String, `minivpn_version` String, `obfs4_version` String, `obfuscation` String, `platform` String, `probe_asn` Int32, `probe_cc` String, `probe_network_name` String, `provider` String, `remote` String, `report_id` String, `resolver_asn` Int32, `resolver_ip` String, `resolver_network_name` String, `software_name` String, `software_version` String, `success` Int8, `success_handshake` Int8, `success_icmp` Int8, `success_urlgrab` Int8, `tcp_connect_status_success` Int8, `test_runtime` Float32, `test_start_time` DateTime, `transport` String)ENGINE = ReplacingMergeTreeORDER BY (measurement_start_time, report_id, input)SETTINGS index_granularity = 8test_groups table
Contains the definition of test groups. Updated manually and read by the API, mainly to show grouping in Explorer 🖱.
Schema:
CREATE TABLE default.test_groups( `test_name` String, `test_group` String)ENGINE = Join(ANY, LEFT, test_name)test_helper_instances table
List of live, draining and destroyed test helper instances. Used by Test helper rotation ⚙ internally.
Schema:
CREATE TABLE default.test_helper_instances( `rdn` String, `dns_zone` String, `name` String, `provider` String, `region` String, `ipaddr` IPv4, `ipv6addr` IPv6, `draining_at` Nullable(DateTime(\'UTC\')), `sign` Int8, `destroyed_at` Nullable(DateTime(\'UTC\')))ENGINE = CollapsingMergeTree(sign)ORDER BY nameSETTINGS index_granularity = 8url_priorities table
This table stores rules to compute priorities for URLs used in Web connectivity test Ⓣ.
See Prioritization 🐝, Prioritization management and Prioritization rules UI 🖱
Schema:
CREATE TABLE default.url_priorities( `sign` Int8, `category_code` String, `cc` String, `domain` String, `url` String, `priority` Int32)ENGINE = CollapsingMergeTree(sign)ORDER BY (category_code, cc, domain, url, priority)SETTINGS index_granularity = 1024ClickHouse system tables
ClickHouse has many system tables that can be used for monitoring performance and debugging.
Tables matching the following names (wildcard) can grow in size and also cause unnecessary I/O load:
system.asynchronous_metric_log*system.metric_log*system.query_log*system.query_thread_log*system.trace_log*Fastpath deduplication
ClickHouse does not deduplicate all records deterministically for performance reasons. Full deduplication can be performed with the following command and it is often required after running the fastpath to reprocess old measurements. Deduplication is CPU and IO-intensive.
time clickhouse-client -u admin --password admin --receive_timeout 9999 --send_timeout 9999 --query 'OPTIMIZE TABLE fastpath FINAL'Dropping tables
ClickHouse has a protection against table drops. Use this to allow dropping a table once. After use the flag file is automatically removed:
sudo touch '/var/lib/clickhouse/flags/force_drop_table' && sudo chmod 666 '/var/lib/clickhouse/flags/force_drop_table'Investigating table sizes
To monitor ClickHouse’s performance and table size growth there’s a dashboard and the ClickHouse queries notebook 📔
To investigate table and index sizes the following query is useful:
SELECT concat(database, '.', table) AS table, formatReadableSize(sum(bytes)) AS size, sum(rows) AS rows, max(modification_time) AS latest_modification, sum(bytes) AS bytes_size, any(engine) AS engine, formatReadableSize(sum(primary_key_bytes_in_memory)) AS primary_keys_sizeFROM system.partsWHERE activeGROUP BY database, tableORDER BY bytes_size DESCimportant The system tables named
asynchronous_metric_log,query_logandquery_thread_logcan be useful for debugging and performance optimization but grow over time and create additional I/O traffic. Also see ClickHouse system tables 💡.
Possible workarounds are:
-
Drop old records.
-
Implement sampling writes that write only a percentage of the records.
-
Disable logging for specific users or queries.
-
Disable logging in the codebase running the query. See https://github.com/ooni/backend/blob/0ec9fba0eb9c4c440dcb7456f2aab529561104ae/fastpath/fastpath/db.py#L177 for an example of custom settings.
-
Disable logging altogether.
Also see Disable unnecessary ClickHouse system tables 🐞
Investigating database performance
If needed a simple script can be run to generate additional metrics and logs to identify slow queries.
while true;do  # Extract longest running query time and send it as a statsd metric  v=$(clickhouse-client -q 'SELECT elapsed FROM system.processes ORDER BY elapsed DESC LIMIT 1')  echo "clickhouse_longest_query_elapsed_seconds:$v|g" | nc -w 1 -u 127.0.0.1 8125
  # Extract count of running queries and send it as a statsd metric  v=$(clickhouse-client -q 'SELECT count() FROM system.processes')  echo "clickhouse_running_queries_count:$v|g" | nc -w 1 -u 127.0.0.1 8125
  # Log long running queries into journald  clickhouse-client -q 'SELECT query FROM system.processes WHERE elapsed > 10' | sed 's/\\n//g' | systemd-cat -t click-queries
  sleep 1done
Continuous Deployment: Database schema changes
The database schema required by the API is stored in https://github.com/ooni/backend/blob/0ec9fba0eb9c4c440dcb7456f2aab529561104ae/api/tests/integ/clickhouse_1_schema.sql
In a typical CD workflows it is possible to deploy database schema changes in a way that provides safety against outages and requires no downtimes.
Any component that can be deployed independently from others can be made responsible for creating and updating the tables it needs. If multiple components access the same table it’s important to coordinate their code updates and deployments during schema changes.
important typical CD requires deployments to be performed incrementally to speed up and simplify rollouts. It does not guarantees that package versions can be rolled forward or back by skipping intermediate versions.
To support such use-case more complex database scheme versioning would be required. Due to hardware resource constraints and time constraints we need to be able to manually create new tables (especially on the test stage) and perform analysis work, run performance and feature tests, troubleshooting etc. As such, at this time the backend components are not checking the database schema against a stored “template” at install or start time.
note A starting point for more automated database versioning existed at https://github.com/ooni/backend/blob/0ec9fba0eb9c4c440dcb7456f2aab529561104ae/api/database_upgrade_schema.py
note in future such check could be implemented and generate a warning to be enabled only on non-test CD stages.
note one way to make database changes at package install time is to use the
debian/postinstscript. For example see https://github.com/ooni/backend/blob/0ec9fba0eb9c4c440dcb7456f2aab529561104ae/fastpath/debian/postinst
important in writing SQL queries explicitly set the columns you need to read or write and access them by name: any new column will be ignored.
Some examples of database schema change workflows:
Adding a new column to the fastpath
The following workflow can be tweaked or simplified to add columns or tables to other components.
note multiple deployments or restarts should not trigger failures: always add columns using
ALTER TABLE <name> ADD COLUMN IF NOT EXISTS <name> <other parameters>
The new column is added either manually or by deploying a new version of the fastpath package that adds the column at install or start time. Ensure the rollout reaches all the CD stages.
Prepare, code-review, merge and deploy a new version of the fastpath that writes data to the new column. Ensure the rollout reaches all the CD stages.
Verify the contents of the new column e.g. using a Jupyter Notebook
Prepare, code-review, merge and deploy a new version of the API that reads data from the new column. Ensure the rollout reaches all the CD stages.
This workflow guarantees that the same schema and codebase has been tested on all stages before reaching production.
Renaming a column or table
This is a more complex workflow especially when multiple components access the same table or column. It can also be used for changing a column type and other invasive changes.
For each of the following steps ensure the rollout reaches all the CD stages.
-
Create a new column or table.
-
Prepare, code-review, merge and deploy a new version of all the components that write data. Write all data to both the old and new column/table.
-
If required, run one-off queries that migrate existing data from the old column/table to the new one. Using
IF NOT EXISTScan be useful. -
Prepare, code-review, merge and deploy a new version of all the components that reads data. Update queries to only read from the new column/table.
-
Prepare, code-review, merge and deploy a new version of all the components that write data. Write data only to the new column/table.
-
Run one-off queries to delete the old column/table. Using
IF EXISTScan be useful for idempotent runs.
Database schema check
To compare the database schemas across backend hosts you can use:
for hn in ams-pg-test backend-hel backend-fsn; do hn=${hn}.ooni.org echo $hn > "schema_${hn}" for tbl in $(ssh $hn 'clickhouse-client -q "SHOW TABLES FROM default"' | grep -v inner_id ); do echo " ${tbl}" ssh $hn "clickhouse-client -q \"SHOW CREATE TABLE default.${tbl}\"" | sed 's/\\n/\n/g' >> "schema_${hn}" donedoneThe generated files can be compared more easily using meld.
Also related: Database backup tool ⚙
GitHub CI workflows
There are 5 main workflows that a run by GitHub Actions when new pull requests are created or updated the backend repository.
They are configured using YAML files in the repository, plus secret keys and other variables that can be edited on https://github.com/ooni/backend/settings/secrets/actions
The workflow files are:
-
.github/workflows/build_deb_packages.yml
-
.github/workflows/docgen.yaml
-
.github/workflows/mypy.yml
-
.github/workflows/test_fastpath.yaml
-
.github/workflows/test_new_api.yml
warning the workflows handle sensitive credentials. GitHub provides security features to prevent 3rd party contributors from running CI actions through pull requests that might expose credentials.
Debian package build and publish
Quick checklist
You would like to make a new release of a software that follows the debops CI procedure? Read ahead.
- Write your code and push it to a branch
- Edit the
debian/changelogfile to add an entry like follows (eg.backend/api/debian/changelog)
ooni-api (1.0.89) unstable; urgency=medium
  * Some changes
 -- OONITarian <contact@ooni.org>  Wed, 21 Feb 2024 16:24:18 +0100
Attention Be sure to update the timestamp and the version string to a newer date, otherwise the package update may not be triggered.
- Commit your changelog entry and wait for CI to build
- Login to the host where you would like to test deploy it and list the available packages
sudo apt-get updateapt-cache madison ooni-api- From the list look for the version number of the package you would like to test. Be sure to first test deploy it on a staging or testing host.
ooni-api | 1.0.89~pr806-275 | https://ooni-internal-deb.s3.eu-central-1.amazonaws.com unstable/main amd64 Packages ooni-api | 1.0.89~pr792-273 | https://ooni-internal-deb.s3.eu-central-1.amazonaws.com unstable/main amd64 Packages- You can then install the desired version by running:
sudo apt-get install ooni-api=1.0.89~pr806-275- Do some validation to ensure the new version is working as intended
Here is a sample python snippet:
import requestsr = requests.post( "https://backend-hel.ooni.org/api/v1/check-in", headers={ #"X-Real-IP": '34.34.19.34', "X-Forwarded-For": '1.34.1.1' }, json={ 'probe_cc': 'IT', 'probe_asn': 'AS8220', 'platform': 'desktop', 'software_name': 'notooniprobe', 'software_version': '1.0.0', 'on_wifi': False, 'charging': False, 'run_type': 'manual', 'web_connectivity': { 'category_codes': [] } })- Once you are happy with the new version, you can push it to production. Merge the PR and do the same you did now for production.
More information
Builds one or more .deb files from the backend repository and uploads them to Debian archives on S3.
The configuration file is:
.github/workflows/build_deb_packages.ymlThe workflow installs the required dependencies as Debian packages and then fetches the debops-ci tool 🔧 from the sysadmin repository
debops-ci tool
A Python script that automates package builds and CI/CD workflows:
-
Detects
debian/directories in the current repository. It inspects file changes tracked by git to identify which projects are being modified. -
Bumps up version numbers according to the package versioning 💡 criteria described below.
-
Builds Debian packages as needed.
-
Generates a Debian archive on S3. Uploads .deb files into it to make them available for deployment.
The script has been designed to address the following requirements:
- Remove dependencies from 3rd party services that might become expensive or be shut down.
- Serverless: do not require a dedicated CI/CD server
- Stateless: allow the script to run in CI and on developer desktops without requiring a local database, cache etc.
- Compatible: generate a package archive that can be used by external users to install ooniprobe on their hosts using standard tooling.
- CI-friendly: minimize the amount of data that needs to be deployed on servers to update a backend component or probe.
- Reproducible: given the same sources the generated output should be virtually identical across different systems. I.e. it should not depend on other software installed locally.
It is used in the CI workflow as:
./debops-ci --show-commands ci --bucket-name ooni-internal-debdebops-ci details
The tool requires the following environment variables for automated ci runs:
-
AWS_ACCESS_KEY_IDandAWS_SECRET_ACCESS_KEYin order to write to S3 buckets. -
DEB_GPG_KEYorDEB_GPG_KEY_BASE64to GPG-sign packages. The first variable can contain a PEM-encoded private key, while the second is base64-encoded.
Other configuration parameters can be set from the command line. See the
-h CLI option:
usage:Version 2023-10-20.1
Builds deb packages and uploads them to S3-compatible storage.Works locally and on GitHub Actions and CircleCIDetects which package[s] need to be built.Support "release" and PR/testing archives.
scan              - scan the current repository for packages to be builtbuild             - locate and build packagesupload <filename> - upload one package to S3ci                - detect CircleCI PRs, build and upload packages
Features: - Implement CI/CD workflow using package archives - Support adding packages to an existing S3 archive without requiring a   local mirror - Support multiple packages in the same git repository - GPG signing - Support multiple architectures - Update changelogs automatically - Easy to debug - Phased updates (rolling deployments)
positional arguments:  {upload,scan,ci,build}
options:  -h, --help            show this help message and exit  --bucket-name BUCKET_NAME                        S3 bucket name  --distro DISTRO       Debian distribution name  --origin ORIGIN       Debian Origin name  --arch ARCH           Debian architecture name  --gpg-key-fp GPG_KEY_FP                        GPG key fingerprint  --show-commands       Show shell commands
When running with the ci or upload commands, the tool creates the
required directories and files on S3 to publish an archive suitable for
APT. It uploads any newly built package and then appends the package
description to the Packages file. It then generates a new InRelease
file and adds a GPG signature at the bottom of the file.
See Packages and InRelease as examples.
The current OONI package archives are:
-
https://ooni-internal-deb.s3.eu-central-1.amazonaws.com/ - for internal use
-
http://deb.ooni.org/ also available as https://deb.ooni.org/ - for publicly available packages
Documentation on how to use the public archive: https://ooni.org/install/cli/ubuntu-debian
The tool can also be used manually e.g. for debugging using actions
scan, build and upload.
Unlike other CI/CD tools, debops-ci is designed to be stateless in order
to run in ephemeral CI worker containers. Due to limitations around
transactional file uploads, a pair of lockfiles are used, named
.debrepos3.lock and .debrepos3.nolock
note If the github actions CI workflow for package build is restarted manually (that is, without git-pushing a new commit) debops-ci will refuse to overwrite the .deb package already present on S3. This is expected.
Package versioning
The CI workflows builds Debian packages with the following versioning scheme:
<semver_version>~pr<pull_request_number>-<build_number>For example:
1.0.79~pr751-194This format has the benefits of:
-
Providing a user-configured semantic versioning part.
-
Automatically inserting a pull request number. This prevents version conflicts in case the first component has not been updated when opening a new pull request.
-
Automatically inserting an incremental build number. This allows incremental deployments of commits on testbeds.
Once a package at a given version is uploaded the CI tool will refuse to overwrite it in future CI runs. This is meant to prevent changing the contents of published packages.
It is recommended to update the debian/changelog file in the first
commit of each new pull request by adding a new semver number and a
short changelog. This helps keeping track of what changes are being
deployed on test, integration and production servers.
Sometimes multiple pull requests for the same package are open at the same time and are rebased or merged in an order that is different from the pull request number. In this case manually bumping up the semver number after each rebase is beneficial to ensure that the rollout is done incrementally.
For example:
-
Pull request 751 builds a package versioned 1.0.79~pr751-14. The package is deployed on the testbed.
-
Pull request 752, opened later, is rebased on top of 751 and builds a package versioned 1.0.80~pr752-51. The package is deployed on the testbed.
-
The need to reorder the two PRs arises. PR 751 is now rebased on top of 752. The changelog file is manually updated to version 1.0.81 The CI now generates 1.0.81~pr751-43 and the packa
See the subchapter on the The deployer tool 🔧
Code documentation generation
The configuration lives at:
.github/workflows/docgen.yamlThe workflow runs ./build_docs.py to generate documentation from the
Python files. It is a script that extracts MarkDown and AsciiDoc
docstrings from the codebase in the backend repository. It also supports
graphviz diagrams using kroki.io It generates a set of HTML files that
are published as GitHub pages as part of the CI workflow.
The outputs is lives at https://ooni.github.io/backend/
At the time of writing it is superseded by the present document.
Mypy
The configuration lives at:
.github/workflows/mypy.ymlIt runs mypy to check Python typing and makes the CI run fail if errors are detected.
Fastpath test
The configuration lives at:
.github/workflows/test_fastpath.yamlRuns the following unit and functional tests against the fastpath:
fastpath/tests/test_functional.pyfastpath/tests/test_functional_nodb.pyfastpath/tests/test_unit.pyThese are not end-to-end tests for the backend e.g. the API is not being tested.
The CI action creates a dedicated container and installs the required dependencies as Debian packages. It provides a code coverage report in HTML format.
API end-to-end test
The configuration lives at:
.github/workflows/test_new_api.ymlThis CI action performs the most comprehensive test of the backed. In sequence:
-
Creates a dedicated container and installs the required dependencies as Debian packages.
-
It starts a ClickHouse container
-
Creates the required database tables, see https://github.com/ooni/backend/blob/0ec9fba0eb9c4c440dcb7456f2aab529561104ae/api/tests/integ/clickhouse_1_schema.sql
-
Initializes the database tables with test data, see https://github.com/ooni/backend/blob/0ec9fba0eb9c4c440dcb7456f2aab529561104ae/api/tests/integ/clickhouse_2_fixtures.sql
-
Runs the fastpath against data from a bucket on S3 in order to populate the
fastpathtable with real data. The measurements come from both:-
A fixed time range in the past
-
Recent data
-
-
It runs unit, functional and integration tests against the API. Integration tests require the API to run queries against multiple tables in ClickHouse.
important the presence of recent data makes the content of the
fastpathdatabase table non deterministic between CI runs. This is necessary to perform integration tests against API entry points that need fresh data. To prevent flaky CI runs write integration tests with to handle variable data. E.g. use broad thresholds like asserting that the number of measurements collected in a day is more than 1.
note prefer unit tests where possible
note To implement precise functional tests, mock out the database.